raquat is one of the most widely used herbicides and is highly toxic to animals. In a study to assess the protective effects of a new agent A against paraquat, 200 rats were randomly assigned to three groups. The first group (treatment I) was administered paraquat; the second group (treatment II) was administered paraquat plus a low dose of agent A; the third group (treatment III) was administered paraquat plus a high dose of agent A. The number of rats that survived more than eight days for each group was recorded and are presented in Table 2. At the 1% level of significance, does the p-value support the claim that agent A affects the survival rate of paraquat infected rats? Explain.


Paraquat is one of the most widely used herbicides and is highly toxic to animals. In a study to assess the protective effects of a new agent A against paraquat, 200 rats were randomly assigned to three groups. The first group (treatment I) was administered paraquat; the second group (treatment II) was administered paraquat plus a low dose of agent A; the third group (treatment III) was administered paraquat plus a high dose of agent A. The number of rats that survived more than eight days for each group was recorded and are presented in Table 2.
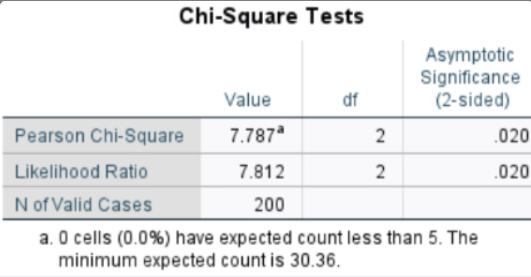
At the 1% level of significance, does the p-value support the claim that agent A affects the survival rate of paraquat infected rats? Explain.
(f) Is the requirement that the expected frequency in each cell is 5 or greater satisfied?
Explain.


The table of observed values is shown below
| Yes | No | Total | |
| I | 25 | 42 | 67 |
| II | 27 | 39 | 66 |
| III | 40 | 27 | 67 |
| Total | 92 | 108 | 200 |

Step by step
Solved in 2 steps with 1 images


