2. The graph below shows data gathered from a series of experiments designed to study a particular enzyme, its substrate, and two potential inhibitors. Line A represents a series of uninhibited reactions. The other two lines represent two series of inhibited reactions. Label which line represents the experiments that utilized a competitive inhibitor, and label which line represents the experiments that utilized a non-competitive inhibitor.
2. The graph below shows data gathered from a series of experiments designed to study a particular enzyme, its substrate, and two potential inhibitors. Line A represents a series of uninhibited reactions. The other two lines represent two series of inhibited reactions. Label which line represents the experiments that utilized a competitive inhibitor, and label which line represents the experiments that utilized a non-competitive inhibitor.

Human Anatomy & Physiology (11th Edition)
11th Edition
ISBN:9780134580999
Author:Elaine N. Marieb, Katja N. Hoehn
Publisher:Elaine N. Marieb, Katja N. Hoehn
Chapter1: The Human Body: An Orientation
Section: Chapter Questions
Problem 1RQ: The correct sequence of levels forming the structural hierarchy is A. (a) organ, organ system,...

Related questions
Question

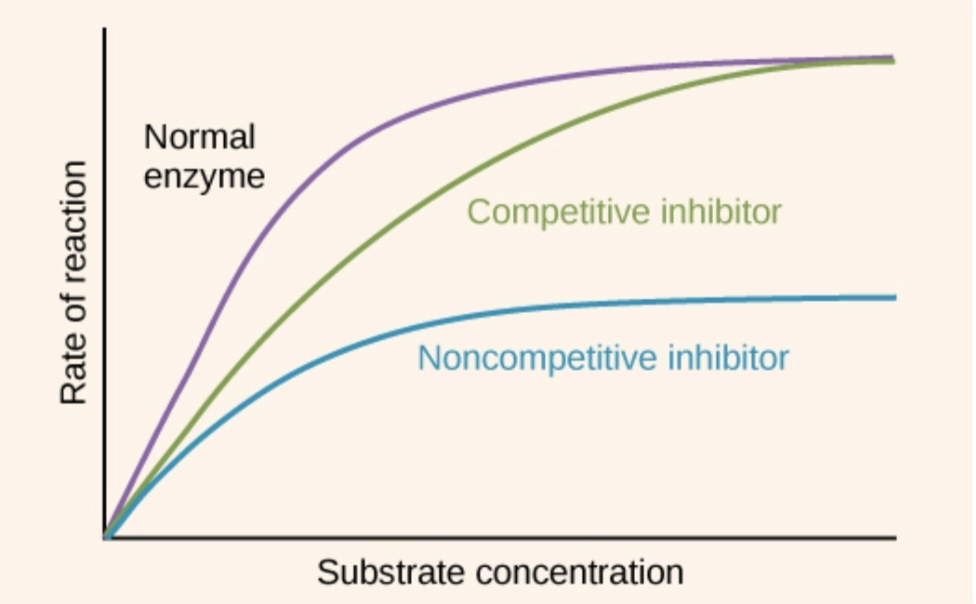
Transcribed Image Text:The graph below shows data gathered from a series of experiments designed to study a particular enzyme, its substrate, and two potential inhibitors. Line A represents a series of **uninhibited reactions**. The other two lines represent two series of **inhibited reactions**. Label which line represents the experiments that utilized a *competitive inhibitor*, and label which line represents the experiments that utilized a *non-competitive inhibitor*.
### Graph Explanation:
- **Axes**:
- The horizontal axis represents "Substrate concentration".
- The vertical axis represents "Reaction Rate".
- **Lines**:
- **Line A**: Represents uninhibited reactions, showing a steady increase in reaction rate with increasing substrate concentration until it plateaus.
- The two other lines (not specifically labeled here) represent reactions with inhibitors:
- One line shows a rise in reaction rate similar to Line A, but reaches a plateau sooner and at a lower rate, indicating a *competitive inhibitor*.
- The other line shows a lower reaction rate at all substrate concentrations, maintaining a flat rate, indicating a *non-competitive inhibitor*.
Expert Solution
Step 1
If we wanted to show that the effects of these inhibitors showing on the graph like the one above, we could be repeat the our whole experiment in the two more times, once with the certain amount of the competitive inhibitor added to the each test reaction, and once with the a certain amount of the noncompetitive inhibitor added instead. We would be get results as follows and showing on the graph.

Step by step
Solved in 2 steps with 1 images

Recommended textbooks for you
Human Anatomy & Physiology (11th Edition)
Biology
ISBN:
9780134580999
Author:
Elaine N. Marieb, Katja N. Hoehn
Publisher:
PEARSON

Biology 2e
Biology
ISBN:
9781947172517
Author:
Matthew Douglas, Jung Choi, Mary Ann Clark
Publisher:
OpenStax

Anatomy & Physiology
Biology
ISBN:
9781259398629
Author:
McKinley, Michael P., O'loughlin, Valerie Dean, Bidle, Theresa Stouter
Publisher:
Mcgraw Hill Education,
Human Anatomy & Physiology (11th Edition)
Biology
ISBN:
9780134580999
Author:
Elaine N. Marieb, Katja N. Hoehn
Publisher:
PEARSON
Biology 2e
Biology
ISBN:
9781947172517
Author:
Matthew Douglas, Jung Choi, Mary Ann Clark
Publisher:
OpenStax
Anatomy & Physiology
Biology
ISBN:
9781259398629
Author:
McKinley, Michael P., O'loughlin, Valerie Dean, Bidle, Theresa Stouter
Publisher:
Mcgraw Hill Education,

Molecular Biology of the Cell (Sixth Edition)
Biology
ISBN:
9780815344322
Author:
Bruce Alberts, Alexander D. Johnson, Julian Lewis, David Morgan, Martin Raff, Keith Roberts, Peter Walter
Publisher:
W. W. Norton & Company

Laboratory Manual For Human Anatomy & Physiology
Biology
ISBN:
9781260159363
Author:
Martin, Terry R., Prentice-craver, Cynthia
Publisher:
McGraw-Hill Publishing Co.

Inquiry Into Life (16th Edition)
Biology
ISBN:
9781260231700
Author:
Sylvia S. Mader, Michael Windelspecht
Publisher:
McGraw Hill Education