
Concept explainers
Videos
Hearing-impaired Americans. The number N, in millions, of hearing-impaired Americans of age x can be approximated by the graph that follows.
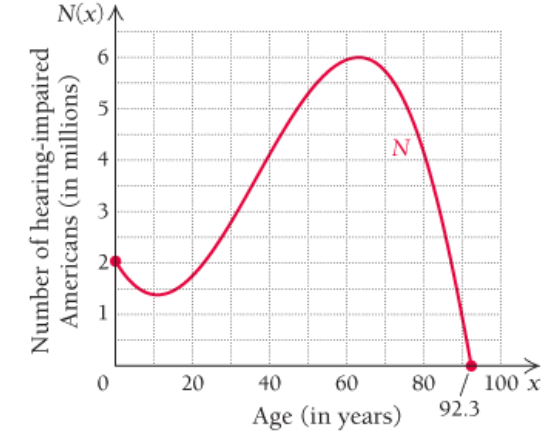
Use the graph to answer the following.
a. Approximate the number of hearing-impaired Americans of ages 20, 40, 50, and 60.
b. For what ages is the number of hearing-impaired Americans approximately 4 million?
c. Estimate the age for which the greatest number of Americans is hearing-impaired.
d. What difficulty do you have in making this determination?
Want to see the full answer?
Check out a sample textbook solution
Chapter R Solutions
Calculus and Its Applications (11th Edition)
Additional Math Textbook Solutions
A First Course in Probability (10th Edition)
Algebra and Trigonometry (6th Edition)
Thinking Mathematically (6th Edition)
University Calculus: Early Transcendentals (4th Edition)
Calculus: Early Transcendentals (2nd Edition)


- the correct answer is C could you please explainarrow_forwardWhich of the functions shown below is differentiable at z = 2? Select the correct answer below: о -7-6-5-4-3-2- −7 −6 −5 −4 −3-2 1 2 4 5 6 -7-6-5-4-3-2- -7-6-5-4-3 2 45arrow_forwardQuestion Given the graph of f(z) below, find the graph of the derivative of f(z). Select the correct answer below: ° ° 129 -7-6-5-4-3-2 -7-6-5-4-3-2-1123456 ° ° °arrow_forward
- Question Find the open interval(s) of f(x), graph given below, where f'(x) is negative. -3-2-1 1 2 4 5 6 Give your answer in interval notation. For example, (2, 4) U (6,∞). Provide your answer below:arrow_forwardthe correct answer is Ccould you please show me how to do it using the residue theoremarrow_forwardUse the information to find and compare Δy and dy. (Round your answers to four decimal places.) y = x4 + 7 x = −3 Δx = dx = 0.01 Δy = dy =arrow_forward
 Glencoe Algebra 1, Student Edition, 9780079039897...AlgebraISBN:9780079039897Author:CarterPublisher:McGraw Hill
 Elementary AlgebraAlgebraISBN:9780998625713Author:Lynn Marecek, MaryAnne Anthony-SmithPublisher:OpenStax - Rice University
 Holt Mcdougal Larson Pre-algebra: Student Edition...AlgebraISBN:9780547587776Author:HOLT MCDOUGALPublisher:HOLT MCDOUGAL
 Algebra: Structure And Method, Book 1AlgebraISBN:9780395977224Author:Richard G. Brown, Mary P. Dolciani, Robert H. Sorgenfrey, William L. ColePublisher:McDougal Littell
 Intermediate AlgebraAlgebraISBN:9781285195728Author:Jerome E. Kaufmann, Karen L. SchwittersPublisher:Cengage Learning
 College Algebra (MindTap Course List)AlgebraISBN:9781305652231Author:R. David Gustafson, Jeff HughesPublisher:Cengage Learning