Concept explainers
Videos
In 1960, William K. Estes proposed the following model for measuring a student’s performance in the classroom:
where k(t) is the student’s knowledge after t weeks (expressed as a percentage and measured by performance on examinations), ℓ is a constant called the coefficient of learning and representing the student’s ability to learn (expressed as a percentage and determined by IQ or some similar general intelligence predictor), and λ is a constant representing the fraction of available time the student spends performing helpful acts that should increase knowledge of the subject (studying, going to class; and so on). Use this model to solve Problems 79 and 80.
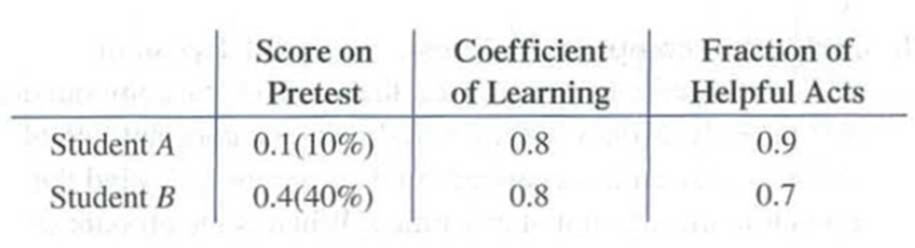
80. Learning theory. Refer to Problem 79. When will both students have the same level of knowledge? Round answer to one decimal place.
79. Learning theory. Students enrolled in a beginning Spanish class are given a pretest the first day of class to determine their knowledge of the subject. The results of the pretest, the coefficient of learning, and the fraction of time spent performing helpful acts for two students in the class are given in the table. Use the Estes model to predict the knowledge of each student after 6 weeks in the class.
Want to see the full answer?
Check out a sample textbook solution
Chapter 9 Solutions
Calculus for Business, Economics, Life Sciences, and Social Sciences (14th Edition)


- solve on paperarrow_forwardsolve the question based on hw 1, 1.41arrow_forwardالتمرين الأول: 08) نقاط) نرمي رباعي وجوه مرقم من ا إلى 4 بحيث إحتمال وجوهه يحقق العلاقة التالية: - 24 = (3)P(1) = ) = 4P -1 أحسب احتمال كل وجه. -2 (١ أحسب احتمال الحادثة : الحصول على عدد زوجي). ب استنتج احتمال الحادثة ة. -3 أحسب احتمال الحادثة B الحصول على عدد د أكبر أو يساوي (2)arrow_forward
- A homeware company has been approached to manufacture a cake tin in the shape of a "ghost" from the Pac-Man video game to celebrate the 45th Anniversary of the games launch. The base of the cake tin has a characteristic dimension / and is illustrated in Figure 1 below, you should assume the top and bottom of the shape can be represented by semi-circles. The vertical sides of the cake tin have a height of h. As the company's resident mathematician, you need to find the values of r and h that minimise the internal surface area of the cake tin given that the volume of the tin is Vfixed- 2r Figure 1 - Plan view of the "ghost" cake tin base. (a) Show that the Volume (V) of the cake tin as a function of r and his 2(+1)²h V = 2arrow_forward15. Please solve this and show each and every step please. PLEASE no chatgpt can I have a real person solve it please!! I am stuck. I am doing pratice problems and I do not even know where to start with this. The question is Please compute the indicated functional value.arrow_forwardSolve the system of equation for y using Cramer's rule. Hint: The determinant of the coefficient matrix is -23. - 5x + y − z = −7 2x-y-2z = 6 3x+2z-7arrow_forward
- ◆ Switch To Light Mode HOMEWORK: 18, 19, 24, 27, 29 ***Please refer to the HOMEWORK sheet from Thursday, 9/14, for the problems ****Please text or email me if you have any questions 18. Figure 5-35 is a map of downtown Royalton, showing the Royalton River running through the downtown area and the three islands (A, B, and C) connected to each other and both banks by eight bridges. The Down- town Athletic Club wants to design the route for a marathon through the downtown area. Draw a graph that models the layout of Royalton. FIGURE 5-35 North Royalton Royalton River South Royption 19. A night watchman must walk the streets of the Green Hills subdivision shown in Fig. 5-36. The night watch- man needs to walk only once along each block. Draw a graph that models this situation.arrow_forwardNo chatgpt pls will upvote Already got wrong chatgpt answerarrow_forwardneed help with my homeworkarrow_forward
- 16.4. Show that if z' is the principal value, then 1+e** z'dz = (1-i), 2 where is the upper semicircle from z = 1 to z = -1.arrow_forwardL 16.8. For each of the following functions f, describe the domain of ana- lyticity and apply the Cauchy-Goursat Theorem to show that f(z)dz = 0, where is the circle |2|=1:1 (a). f(z) = 1 z 2 + 2x + 2 (b). f(z) = ze*. What about (c). f(z) = (2z-i)-2?arrow_forward16.3. Evaluate each of the following integrals where the path is an arbitrary contour between the limits of integrations (a). [1 ri/2 edz, (b). (b). La cos COS (2) d dz, (c). (z−3)³dz. 0arrow_forward
 Functions and Change: A Modeling Approach to Coll...AlgebraISBN:9781337111348Author:Bruce Crauder, Benny Evans, Alan NoellPublisher:Cengage Learning
 Algebra & Trigonometry with Analytic GeometryAlgebraISBN:9781133382119Author:SwokowskiPublisher:Cengage
 Trigonometry (MindTap Course List)TrigonometryISBN:9781337278461Author:Ron LarsonPublisher:Cengage Learning

 Algebra: Structure And Method, Book 1AlgebraISBN:9780395977224Author:Richard G. Brown, Mary P. Dolciani, Robert H. Sorgenfrey, William L. ColePublisher:McDougal Littell