
Videos
For Problems 7-21, please provide the following information.
(a) What is the level of significance? Stale the null and alternate hypotheses, (b) Check Requirements What sampling distribution will you use? Do you think the sample size is sufficiently large? Explain Compute the value of the sample test statistic and corresponding z value. (c) Find the P-value of the test statistic Sketch the sampling distribution and show the area corresponding to the P-value.
(d) Based on sour answers in parts (a) to (c), will you reject or fail to reject the null hypothesis? Are the data statistic ally significant at level
(c) Interpret your conclusion in the context of the application.
Focus Problem: Benford's Law Please read the Focus Problem at the beginning of this chapter. Recall that Benford's Lam claims that numbers chosen from very large data files lend to have " 1“ as the first nonzero digit disproportionately often. In fact, research has shown that if you randomly draw a number from a very large data file, the
Now suppose you are an auditor for a very large corporation. The revenue report involves millions of numbers in a large computer file. Let us say you took a random sample of n = 215numerical entries from the file, and r = 46 of the entries had a first nonzero digit of 1. Let p represent the population proportion of all numbers in the corporate file that have a first nonzero digit of 1.
Test the claim that p is less than 0.301 Use
If p is in fact less than 0.301, would it make you suspect that there are not enough numbers in the data file with leading Is? Could this indicate that the books have been “cooked" by “pumping up" or inflating the numbers? Comment from the view point of a stockholder. Comment from the perspective of the Federal Bureau of Investigation as ii looks for money laundering in the form of false profits.
iii. Comment on the following statement “If we reject the null hypothesis at level of significance
(i)
(a)
The level of significance, null and alternative hypothesis.
Answer to Problem 7P
Solution: The level of significance is
Explanation of Solution
The level of significance is defined as the probability of rejecting the null hypothesis when it is true, it is denoted by
Null hypothesis
Alternative hypothesis
(b)
To find: The sampling distribution that should be used and compute the z value of the sample test statistic.
Answer to Problem 7P
Solution: The sampling distribution
Explanation of Solution
Calculation:
The
The standardized sample test statistic for
(c)
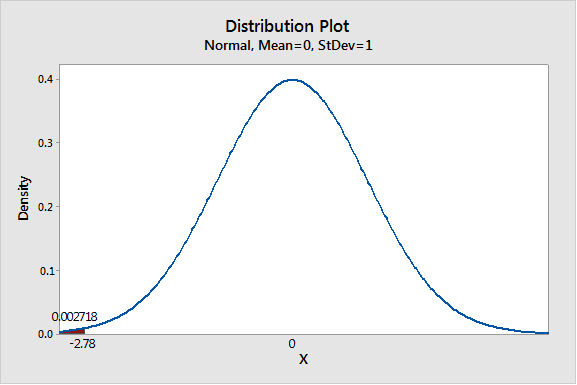
To find: The P-value of the test statistic and sketch the sampling distribution showing the area corresponding to the P-value.
Answer to Problem 7P
Solution: The P-value of the test statistic is 0.0027.
Explanation of Solution
Calculation:
We have z = -2.78
Using Table 3 from the Appendix to find the specified area:
Thus P- value is 0.0027.
Graph:
To draw the required graphs using the Minitab, follow the below instructions:
Step 1: Go to the Minitab software.
Step 2: Go to Graph > Probability distribution plot > View probability.
Step 3: Select ‘Normal’ and enter Mean 0 and Standard deviation 1.
Step 4: Click on the Shaded area > X value.
Step 5: Enter X-value as -2.78 and select ‘Left tail’.
Step 6: Click on OK.
The obtained distribution graph is:
(d)
Whether we reject or fail to reject the null hypothesisand whether the data is statistically significant for a level of significance of 0.01.
Answer to Problem 7P
Solution: The P-value
Explanation of Solution
The P-value of 0.0027 is less than the level of significance (
(e)
The interpretation for the conclusion.
Answer to Problem 7P
Solution: There is enough evidence to conclude that population proportion of numbers with leading “1” in the revenue file is less than the probability 0.301 predicted by Benford’s law.
Explanation of Solution
The P-value of 0.0027 is less than the level of significance (
(ii)
To explain: Whether it is suspect that there are not enough numbers in the data file with leading 1's.
Answer to Problem 7P
Solution: Yes. The revenue data file seems to include more numbers with higher first nonzero digits than Benford's law predicts.
Explanation of Solution
There are not enough numbers in the data file with leading 1's than Benford's law predicts. So, we cannot say that it is an indication of the books have been “cooked” by “pumping up” or inflating the numbers. From the viewpoint of a stockholder and the Federal Bureau of Investigation as it looks for money laundering, it may be true or false profit because there are not enough numbers in the data file with leading 1’s.
(iii)
To explain: Whether it recommends further investigation before accusing the company of fraud.
Answer to Problem 7P
Solution: Our data lead us to reject the null hypothesis, more investigation is merited.
Explanation of Solution
Since, we reject the null hypothesis
Want to see more full solutions like this?
Chapter 9 Solutions
Student Solutions Manual for Brase/Brase's Understanding Basic Statistics, 7th


- I need help with this problem and an explanation of the solution for the image described below. (Statistics: Engineering Probabilities)arrow_forward310015 K Question 9, 5.2.28-T Part 1 of 4 HW Score: 85.96%, 49 of 57 points Points: 1 Save of 6 Based on a poll, among adults who regret getting tattoos, 28% say that they were too young when they got their tattoos. Assume that six adults who regret getting tattoos are randomly selected, and find the indicated probability. Complete parts (a) through (d) below. a. Find the probability that none of the selected adults say that they were too young to get tattoos. 0.0520 (Round to four decimal places as needed.) Clear all Final check Feb 7 12:47 US Oarrow_forwardhow could the bar graph have been organized differently to make it easier to compare opinion changes within political partiesarrow_forward
- 30. An individual who has automobile insurance from a certain company is randomly selected. Let Y be the num- ber of moving violations for which the individual was cited during the last 3 years. The pmf of Y isy | 1 2 4 8 16p(y) | .05 .10 .35 .40 .10 a.Compute E(Y).b. Suppose an individual with Y violations incurs a surcharge of $100Y^2. Calculate the expected amount of the surcharge.arrow_forward24. An insurance company offers its policyholders a num- ber of different premium payment options. For a ran- domly selected policyholder, let X = the number of months between successive payments. The cdf of X is as follows: F(x)=0.00 : x < 10.30 : 1≤x<30.40 : 3≤ x < 40.45 : 4≤ x <60.60 : 6≤ x < 121.00 : 12≤ x a. What is the pmf of X?b. Using just the cdf, compute P(3≤ X ≤6) and P(4≤ X).arrow_forward59. At a certain gas station, 40% of the customers use regular gas (A1), 35% use plus gas (A2), and 25% use premium (A3). Of those customers using regular gas, only 30% fill their tanks (event B). Of those customers using plus, 60% fill their tanks, whereas of those using premium, 50% fill their tanks.a. What is the probability that the next customer will request plus gas and fill the tank (A2 B)?b. What is the probability that the next customer fills the tank?c. If the next customer fills the tank, what is the probability that regular gas is requested? Plus? Premium?arrow_forward
- 38. Possible values of X, the number of components in a system submitted for repair that must be replaced, are 1, 2, 3, and 4 with corresponding probabilities .15, .35, .35, and .15, respectively. a. Calculate E(X) and then E(5 - X).b. Would the repair facility be better off charging a flat fee of $75 or else the amount $[150/(5 - X)]? [Note: It is not generally true that E(c/Y) = c/E(Y).]arrow_forward74. The proportions of blood phenotypes in the U.S. popula- tion are as follows:A B AB O .40 .11 .04 .45 Assuming that the phenotypes of two randomly selected individuals are independent of one another, what is the probability that both phenotypes are O? What is the probability that the phenotypes of two randomly selected individuals match?arrow_forward53. A certain shop repairs both audio and video compo- nents. Let A denote the event that the next component brought in for repair is an audio component, and let B be the event that the next component is a compact disc player (so the event B is contained in A). Suppose that P(A) = .6 and P(B) = .05. What is P(BA)?arrow_forward
 College Algebra (MindTap Course List)AlgebraISBN:9781305652231Author:R. David Gustafson, Jeff HughesPublisher:Cengage Learning
 Glencoe Algebra 1, Student Edition, 9780079039897...AlgebraISBN:9780079039897Author:CarterPublisher:McGraw Hill