
Videos
(a)
(i)
The level of significance, null and alternative hypothesis.
(a)
(i)
Answer to Problem 10CRP
Solution:
The level of significance is α = 0.05. The null hypothesis is
Explanation of Solution
The level of significance is defined as the probability of rejecting the null hypothesis when it is true, it is denoted by
Null hypothesis
Alternative hypothesis
(ii)
To find:
The sampling distribution that should be used and compute the value of the sample test statistic.
(ii)
Answer to Problem 10CRP
Solution:
The
Explanation of Solution
Calculation:
We will use the normal distribution to binomial, if the condition np > 5 and nq > 5 are satisfied.
Both conditions are met, so we can use normal distribution.
Using
The sample test statistic z is
(iii)
To find:
The P-value of the test statistic and sketch the sampling distribution showing the area corresponding to the P-value.
(iii)
Answer to Problem 10CRP
Solution:
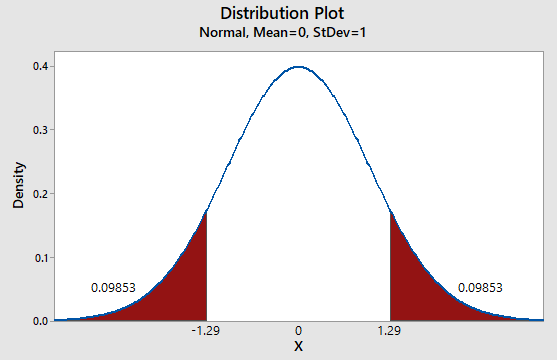
The P-value of the test statistic is 0.1970.
Explanation of Solution
Calculation:
We have z = 1.29
For a two tailed test, the P-value is 0.1970.
Graph:
To draw the required graphs using the Minitab, follow the below instructions:
Step 1: Go to the Minitab software.
Step 2: Go to Graph > Probability distribution plot > View probability.
Step 3: Select ‘Normal’ and Mean = 0, Standard deviation = 1.
Step 4: Click on the Shaded area > X value.
Step 5: Enter X-value as 1.29 and select ‘Both Tail’.
Step 6: Click on OK.
The obtained distribution graph is:
(iv)
Whether we reject or fail to reject the null hypothesisand whether the data is statistically significant for a level of significance of 0.05.
(iv)
Answer to Problem 10CRP
Solution:
The P-value > α, hence we fail to reject the
Explanation of Solution
The P-value of 0.1970 is greater than the level of significance (α) of 0.05. Therefore we don't have enough evidence to reject the null hypothesis
(v)
The interpretation for the conclusion.
(v)
Answer to Problem 10CRP
Solution:
There is not enough evidence to conclude that the students at this school are significantly different from the overall proportion of 16-19 year older who is victims of crime.
Explanation of Solution
The P-value of 0.1970 is greater than the level of significance (
(b)
To find:
The 90% confidence interval for the proportion of students in the school who have been victims of a crime.
(b)
Answer to Problem 10CRP
Solution:
The 90% confidence interval for p is (0.079, 0.221).
Explanation of Solution
Calculation:
We have to find 90% confidence interval. Using,
90% confidence interval is
The 90% confidence interval for p is (0.079, 0.221).
(c)
To find: The minimum
(c)
Answer to Problem 10CRP
Solution:
The sample size is 193 so that the margin of error is not more than 0.05
Explanation of Solution
Calculation:
We have the sample size formula as follows
Therefore n = 193 is the minimum sample size to ensure that the margin of error E is not more than 0.05.
Want to see more full solutions like this?
Chapter 9 Solutions
Student Solutions Manual for Brase/Brase's Understanding Basic Statistics, 7th


- I need help on filling out this following table for statistics. Please help me find the chi squared value as well It has been suggusted that the highest priority of retirees is travel. Thus, a study was conducted to investigate the differences in the length of stay of a trip for pre- and post-retirees. A sample of 714 travelers were asked how long they stayed on a typical trip. The observed results of the study are found below. You may round all answers for this problem to the nearest hundredth. To import data to R, copy and paste the R codes below number=c(rep("4-7",421),rep("8-13",154),rep("14-21",88),rep("22_or_more",51)) retirement=c(rep("pre-retirement",248),rep("post-retirement",173),rep("pre-retirement",79),rep("post-retirement",75),rep("pre-retirement",36),rep("post- retirement",52),rep("pre-retirement",11),rep("post-retirement",40)) data=data.frame(number,retirement) table(data) With this information, construct a table of estimated expected values. Use two digits after the…arrow_forwardThe purpose of this problem is to solve the Black-Scholes PDE with analytical techniques, which will lead us back to the Black-Scholes formula. The technique is very similar to the one used with the Feynman-Kac formula back in MATH 467. Let's consider the PDE given by with terminal condition f(T,x) af + Ət 1 02 ર .2მ2 f af მ2 +rx მე - rf = 0, = (x-K)+. The solution f(t, x) corresponds to the price of a call option (given the initial condition) at time t if the stock price is x. (a) The first two things that prevent us from solving this PDE directly are (i) the fact that we have a terminal condition, instead of an initial condition; (ii) the terms in front of the derivatives are not constant. To address these, we use the transformation g(t, x) = ƒ(T − t,e³), equivalent to f(t, x) = g(T-t, log(x)). Under this condition, determine the PDE and the initial condition satisfied by g. (b) Now, the PDE obtained in (a) should have an initial condition and constant coeffi- cients, but it still…arrow_forwardPlease help me answer question b and c for this problem.A student project involved collecting data to see if there was a difference in the amount of time one had to wait at the drive-thru between two fast food restaurants, A and B. She randomly selected 30 cars at fast food restaurant A and 30 cars at fast food restaurant B. For each car chosen, she recorded how much time passed from the placement of the order to receiving their food at the pick-up window. The data is given in the table below measured in Seconds. Use α=0.05.CSV…arrow_forward
- Please help me with the following statistics problem A long-distance runner wants to compare the durability of two running shoe brands: Brand A and Brand B. Instead of testing them separately, 15 runners simultaneously wear Brand A on the left foot and Brand B on the right foot during training runs. The runner continues training as usual and tracks how many kilometers each shoe lasts before showing significant wear (e.g., loss of cushioning, outsole damage). Since both shoes experience the same runner, terrain, and conditions, any lifespan difference can be attributed to the shoe brand rather than external factors. Test whether Brand A running shoes have a significantly shorter lifespan than Brand B when worn under the same conditions by the same runner. CSV: "","A","B" "A",197,193 "B",230,229 "C",179,180 "D",206,205 "E",182,180 "F",141,142 "G",207,207 "H",116,112 "I",78,79 "J",0,0 "K",213,212 "L",86,83 "M",181,181 "N",85,79 "O",73,71 The…arrow_forwardAn article appeared in the Journal of Gambling Issues, in which the authors looked at random samples of Ontario residents who (i) have not completed some form of post-secondary education and (ii) have completed some form of post-secondary education. A code of 0 indicates the person does not have a gambling problem, a code of 1 indicates the person does have a gambling problem. The data is found in the accompanying data file. Download.csv file To count the frequencies of 0 and 1 in each sample, use the table(your_dataset_name$ column's name) function. Make sure to replace "your_dataset_name" with the actual name of your data file and specify the correct column name. For example: table(file60c5d1286c735$ CompletedPSEducation) Let PNOPS represent the proportion of persons not completing some form of post-secondary education who have a gambling problem, and PPs be the proportion of persons having completed post-secondary education who have a gambling problem. (a) Find a 92% confidence…arrow_forwardWe consider a (European) call option on a stock with expiration in 3 months and strike price $10. The annual interest rate on the market is r = 4%. The current price of the stock is $10 and we assume that the stock follows a geometric Brownian motion (Black-Scholes) model with parameters = 6% and σ = 0.2. (a) Determine the price Fo of this option at time t = : 0 (today). (b) Using the formulas provided in the lecture videos, calculate the value of each of the Greeks for this option. Namely, calculate A, T, v, О, p. (c) Find a formula for the change of the option price with respect to a change in the af (St, t) Әк strike price. In other words, determine (d) For each of the suggested modifications below, use an approximation to determine the change in the price of the option above without actually recalculating the price. For each one, provide an intuitive argument to explain why the price increases or decreases. (i) The rate of return μ decreases to 5%. (ii) The interest rate r…arrow_forward
- A box containing 24 seemly identical resistors has just been received. However,unbeknownst, 4 of these resistors are defective. a. Five resistors are randomly selected from this box without replacement (oncemoved from the box it is not returned to the box), what is the probability that oneor more of the defective resistors is among those selected? b. Five resistors are randomly selected from this box with replacement (after theresistor is removed and checked, it is returned to the box prior to the nextselection (hence the same resistor can be selected more than once)), what is theprobability that one or more of the defective resistors is among those selected?arrow_forwardBusiness Discussarrow_forwardTriola statistics Readers who prefer printed books Readers who prefer e-booksarrow_forward
- The following is a list of data on the duration of a sample of 200 outbreaks, in hours. 107 73 68 97 76 79 94 59 98 57 54 65 71 70 84 88 62 82 61 79 98 66 62 79 86 68 74 61 62 116 65 88 64 79 78 74 92 75 5289 85 28 73 80 68 78 89 72 78 88 77 103 88 63 68 90 62 89 71 71 74 222 R 82 79 70 ST☑ 65 98 77 86 58 69 88 81 74 70 65 81 75 81 78 90 78 96 75 KRRE F S 62 94 62 79 83 93 135 71 85 84 83 63 61 65 83 70 70 81 77 72 84 33 62 92 65 67 59 58 66 66 94 77 63 71 101 78 43 78 66 75 68 76 59 67 61 71 64 76 72 77 74 65 82 86 66 86 68 85 27% 96 72 77 60 67 87 83 68 72 74 91 76 83 งงง 8 སྐྱ ཐྭ ༄ ཏྱཾ 89 81 71 85 99 59 92 87 84 75 77 51 45 80 84 93 69 76 89 75 67 92 89 82 96 77 102 66 68 61 73 72 76 73 77 79 94 63 59 62 71 81 65 73 63 63 89 82 64 85 92 64 73 a. What is the variable? What type? b. Construct an interval-frequency table, with columns containing: class mark, absolute frequency, relative frequency, cumulative frequency, cumulative relative frequency, and percentage frequency.arrow_forwardThis is the information about the actors who won the Best Actor Oscar: Best actors 44 41 62 52 41 34 34 52 41 37 38 34 32 40 43 56 41 39 49 57 35 30 39 41 44 41 38 42 52 51 49 35 47 31 47 37 57 42 45 42 44 62 43 42 48 49 56 38 60 30 40 42 36 76 39 53 45 36 62 43 51 32 42 54 52 37 38 32 45 60 46 40 36 47 29 43 a. What is the variable? What type? b. Construct an interval-frequency table, with columns containing: class mark, absolute frequency, relative frequency, cumulative frequency, cumulative relative frequency, and percentage frequency.arrow_forwardans c plsarrow_forward
 College Algebra (MindTap Course List)AlgebraISBN:9781305652231Author:R. David Gustafson, Jeff HughesPublisher:Cengage Learning
 Glencoe Algebra 1, Student Edition, 9780079039897...AlgebraISBN:9780079039897Author:CarterPublisher:McGraw Hill
 Holt Mcdougal Larson Pre-algebra: Student Edition...AlgebraISBN:9780547587776Author:HOLT MCDOUGALPublisher:HOLT MCDOUGAL