
Concept explainers
Videos
Expand Your Knowledge: Time Series and Serial
Original Time Series
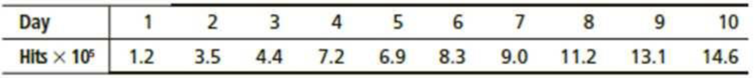
- (a) To construct a serial correlation, we use data pairs (x, y) where x = original data and y = original data shifted ahead by one time period. Verify that the data set (x, y) for serial correlation is shown here. (For discussion of serial correlation, see Problem 15.)
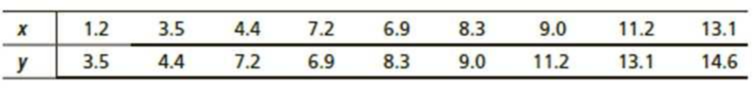
- (b) For the (x, y) data set of part (a), compute the equation of the sample least-squares line
- (c) Compute the sample
correlation coefficient r and the coefficient of determination r2. Test ρ > 0 at the 1 % level of significance. Would you say the time series of web site hits is relatively predictable from one day to the next? Explain.15. Expand Your Knowledge: Time Series and Serial Correlation Serial correlation, also known as autocorrelation, describes the extent to which the result in one period of a time series is related to the result in the next period. A time series with high serial correlation is said to be very predictable from one period to the next. If the serial correlation is low (or near zero), the time series is considered to be much less predictable. For more information about serial correlation, see the book Ibbotson SBBI published by Morningstar.
A research veterinarian at a major university has developed a new vaccine to protect horses from West Nile virus. An important question is: How predictable is the buildup of antibodies in the horse’s blood after the vaccination is given? A large random sample of horses from Wyoming were given the vaccination. The average antibody buildup factor (as determined from blood samples) was measured each week after the vaccination for 8 weeks. Results are shown in the following time series:
Original Time Series
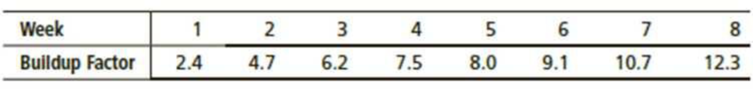
To construct a serial correlation, we simply use data pairs (x, y) where x = original buildup factor data and y = original data shifted ahead by 1 week. This gives us the following data set. Since we are shifting 1 week ahead, we now have 7 data pairs (not 8).
Data for Serial Correlation

For convenience, we are given the following sums:
∑x = 48.6 ∑y = 58.5 ∑x2 = 383.84 ∑y2 = 529.37 ∑xy = 448.7
- (a) Use the sums provided (or a calculator with least-squares regression) to compute the equation of the sample least-squares line,
- (b) Compute the sample correlation coefficient r and the coefficient of determination r2. Test ρ > 0 at the 1% level of significance. Would you say the time series of antibody buildup factor is relatively predictable from one week to the next? Explain.
Want to see the full answer?
Check out a sample textbook solution
Chapter 9 Solutions
Bundle: Understandable Statistics: Concepts And Methods, 12th + Jmp Printed Access Card For Peck's Statistics + Webassign Printed Access Card For ... And Methods, 12th Edition, Single-term


- Examine the Variables: Carefully review and note the names of all variables in the dataset. Examples of these variables include: Mileage (mpg) Number of Cylinders (cyl) Displacement (disp) Horsepower (hp) Research: Google to understand these variables. Statistical Analysis: Select mpg variable, and perform the following statistical tests. Once you are done with these tests using mpg variable, repeat the same with hp Mean Median First Quartile (Q1) Second Quartile (Q2) Third Quartile (Q3) Fourth Quartile (Q4) 10th Percentile 70th Percentile Skewness Kurtosis Document Your Results: In RStudio: Before running each statistical test, provide a heading in the format shown at the bottom. “# Mean of mileage – Your name’s command” In Microsoft Word: Once you've completed all tests, take a screenshot of your results in RStudio and paste it into a Microsoft Word document. Make sure that snapshots are very clear. You will need multiple snapshots. Also transfer these results to the…arrow_forward2 (VaR and ES) Suppose X1 are independent. Prove that ~ Unif[-0.5, 0.5] and X2 VaRa (X1X2) < VaRa(X1) + VaRa (X2). ~ Unif[-0.5, 0.5]arrow_forward8 (Correlation and Diversification) Assume we have two stocks, A and B, show that a particular combination of the two stocks produce a risk-free portfolio when the correlation between the return of A and B is -1.arrow_forward
- 9 (Portfolio allocation) Suppose R₁ and R2 are returns of 2 assets and with expected return and variance respectively r₁ and 72 and variance-covariance σ2, 0%½ and σ12. Find −∞ ≤ w ≤ ∞ such that the portfolio wR₁ + (1 - w) R₂ has the smallest risk.arrow_forward7 (Multivariate random variable) Suppose X, €1, €2, €3 are IID N(0, 1) and Y2 Y₁ = 0.2 0.8X + €1, Y₂ = 0.3 +0.7X+ €2, Y3 = 0.2 + 0.9X + €3. = (In models like this, X is called the common factors of Y₁, Y₂, Y3.) Y = (Y1, Y2, Y3). (a) Find E(Y) and cov(Y). (b) What can you observe from cov(Y). Writearrow_forward1 (VaR and ES) Suppose X ~ f(x) with 1+x, if 0> x > −1 f(x) = 1−x if 1 x > 0 Find VaRo.05 (X) and ES0.05 (X).arrow_forward
- Joy is making Christmas gifts. She has 6 1/12 feet of yarn and will need 4 1/4 to complete our project. How much yarn will she have left over compute this solution in two different ways arrow_forwardSolve for X. Explain each step. 2^2x • 2^-4=8arrow_forwardOne hundred people were surveyed, and one question pertained to their educational background. The results of this question and their genders are given in the following table. Female (F) Male (F′) Total College degree (D) 30 20 50 No college degree (D′) 30 20 50 Total 60 40 100 If a person is selected at random from those surveyed, find the probability of each of the following events.1. The person is female or has a college degree. Answer: equation editor Equation Editor 2. The person is male or does not have a college degree. Answer: equation editor Equation Editor 3. The person is female or does not have a college degree.arrow_forward
 Big Ideas Math A Bridge To Success Algebra 1: Stu...AlgebraISBN:9781680331141Author:HOUGHTON MIFFLIN HARCOURTPublisher:Houghton Mifflin Harcourt
 Glencoe Algebra 1, Student Edition, 9780079039897...AlgebraISBN:9780079039897Author:CarterPublisher:McGraw Hill
 Algebra and Trigonometry (MindTap Course List)AlgebraISBN:9781305071742Author:James Stewart, Lothar Redlin, Saleem WatsonPublisher:Cengage Learning
 Holt Mcdougal Larson Pre-algebra: Student Edition...AlgebraISBN:9780547587776Author:HOLT MCDOUGALPublisher:HOLT MCDOUGAL
