
Bundle: Understandable Statistics: Concepts And Methods, 12th + Jmp Printed Access Card For Peck's Statistics + Webassign Printed Access Card For ... And Methods, 12th Edition, Single-term
12th Edition
ISBN: 9781337758925
Author: Charles Henry Brase, Corrinne Pellillo Brase
Publisher: Cengage Learning
expand_more
expand_more
format_list_bulleted
Concept explainers
Videos
Textbook Question
Chapter 9.2, Problem 6P
Critical Thinking: Interpreting Computer Printouts Refer to the description of a computer display for regression described in Problem 5. The following Minitab display gives information regarding the relationship between the body weight of a child (in kilograms) and the metabolic rate of the child (in 100 kcal/24 hr). The data is based on information from The Merck Manual (a commonly used reference in medical schools and nursing programs).
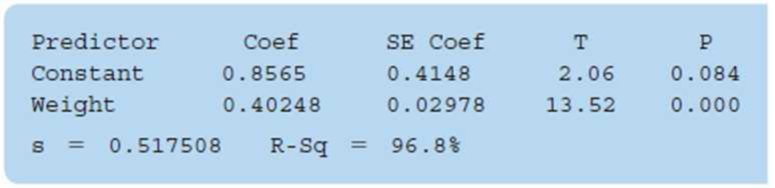
- (a) Write out the least-squares equation.
- (b) For each 1-kilogram increase in weight, how much does the metabolic rate of a child increase?
- (c) What is the value of the sample
correlation coefficient r? - (d) Interpretation What percentage of the variation in y can be explained by the corresponding variation in x and the least-squares line? What percentage is unexplained?
Expert Solution & Answer
Want to see the full answer?
Check out a sample textbook solution
Students have asked these similar questions
The following ordered data list shows the data speeds for cell phones used by a
telephone company at an airport:
A. Calculate the Measures of Central Tendency from the ungrouped data list.
B. Group the data in an appropriate frequency table.
C. Calculate the Measures of Central Tendency using the table in point B.
0.8
1.4
1.8
1.9
3.2
3.6
4.5
4.5
4.6
6.2
6.5
7.7
7.9
9.9
10.2
10.3
10.9
11.1
11.1
11.6
11.8
12.0
13.1
13.5
13.7
14.1
14.2
14.7
15.0
15.1
15.5
15.8
16.0
17.5
18.2
20.2
21.1
21.5
22.2
22.4
23.1
24.5
25.7
28.5
34.6
38.5
43.0
55.6
71.3
77.8
II Consider the following data matrix X:
X1
X2
0.5
0.4
0.2 0.5
0.5
0.5
10.3 10
10.1 10.4
10.1
10.5
What will the resulting clusters be when using the k-Means method with k = 2. In your own words, explain why this result is
indeed expected, i.e. why this clustering minimises the ESS map.
why the answer is 3 and 10?
Chapter 9 Solutions
Bundle: Understandable Statistics: Concepts And Methods, 12th + Jmp Printed Access Card For Peck's Statistics + Webassign Printed Access Card For ... And Methods, 12th Edition, Single-term
Ch. 9.1 - Statistical Literacy When drawing a scatter...Ch. 9.1 - Prob. 2PCh. 9.1 - Prob. 3PCh. 9.1 - Prob. 4PCh. 9.1 - Prob. 5PCh. 9.1 - Prob. 6PCh. 9.1 - Prob. 7PCh. 9.1 - Prob. 8PCh. 9.1 - Prob. 9PCh. 9.1 - Critical Thinking: Lurking Variables Over the past...
Ch. 9.1 - Prob. 11PCh. 9.1 - Prob. 12PCh. 9.1 - Prob. 13PCh. 9.1 - Health Insurance: Administrative Cost The...Ch. 9.1 - Prob. 15PCh. 9.1 - Geology: Earthquakes Is the magnitude of an...Ch. 9.1 - Prob. 17PCh. 9.1 - Prob. 18PCh. 9.1 - Prob. 19PCh. 9.1 - Prob. 20PCh. 9.1 - Prob. 21PCh. 9.1 - Prob. 22PCh. 9.1 - Prob. 23PCh. 9.1 - Prob. 24PCh. 9.2 - Statistical Literacy In the least-squares line...Ch. 9.2 - Prob. 2PCh. 9.2 - Critical Thinking When we use a least-squares line...Ch. 9.2 - Prob. 4PCh. 9.2 - Prob. 5PCh. 9.2 - Critical Thinking: Interpreting Computer Printouts...Ch. 9.2 - Prob. 7PCh. 9.2 - For Problems 718, please do the following. (a)...Ch. 9.2 - Prob. 9PCh. 9.2 - For Problems 718, please do the following. (a)...Ch. 9.2 - Prob. 11PCh. 9.2 - Prob. 12PCh. 9.2 - For Problems 718, please do the following. (a)...Ch. 9.2 - Prob. 14PCh. 9.2 - Prob. 15PCh. 9.2 - For Problems 718, please do the following. (a)...Ch. 9.2 - Prob. 17PCh. 9.2 - Prob. 18PCh. 9.2 - Prob. 19PCh. 9.2 - Residual Plot: Miles per Gallon Consider the data...Ch. 9.2 - Prob. 21PCh. 9.2 - Prob. 22PCh. 9.2 - Prob. 23PCh. 9.2 - Prob. 24PCh. 9.2 - Prob. 25PCh. 9.3 - Prob. 1PCh. 9.3 - Prob. 2PCh. 9.3 - Prob. 3PCh. 9.3 - Prob. 4PCh. 9.3 - Prob. 5PCh. 9.3 - Prob. 6PCh. 9.3 - Prob. 7PCh. 9.3 - In Problems 712, parts (a) and (b) relate to...Ch. 9.3 - Prob. 9PCh. 9.3 - Prob. 10PCh. 9.3 - In Problems 712, parts (a) and (b) relate to...Ch. 9.3 - Prob. 12PCh. 9.3 - Prob. 13PCh. 9.3 - Prob. 14PCh. 9.3 - Prob. 15PCh. 9.3 - Expand Your Knowledge: Time Series and Serial...Ch. 9.3 - Prob. 17PCh. 9.4 - Statistical Literacy Given the linear regression...Ch. 9.4 - Prob. 2PCh. 9.4 - For Problems 3-6, use appropriate multiple...Ch. 9.4 - For Problems 3-6, use appropriate multiple...Ch. 9.4 - Prob. 5PCh. 9.4 - Prob. 6PCh. 9 - Prob. 1CRPCh. 9 - Prob. 2CRPCh. 9 - Prob. 3CRPCh. 9 - Prob. 4CRPCh. 9 - Prob. 5CRPCh. 9 - Prob. 6CRPCh. 9 - Prob. 7CRPCh. 9 - Prob. 8CRPCh. 9 - Prob. 9CRPCh. 9 - Prob. 10CRPCh. 9 - Prob. 1DHCh. 9 - Prob. 1LCCh. 9 - Prob. 1UTCh. 9 - Prob. 2UTCh. 9 - Prob. 3UTCh. 9 - Prob. 4UTCh. 9 - Prob. 5UTCh. 9 - Prob. 6UTCh. 9 - Prob. 7UTCh. 9 - In Problems 16, please use the following steps (i)...Ch. 9 - Prob. 2CURPCh. 9 - Prob. 3CURPCh. 9 - Prob. 4CURPCh. 9 - Prob. 5CURPCh. 9 - Prob. 6CURPCh. 9 - Prob. 8CURPCh. 9 - Linear Regression: Blood Glucose Let x be a random...
Knowledge Booster


Learn more about
Need a deep-dive on the concept behind this application? Look no further. Learn more about this topic, statistics and related others by exploring similar questions and additional content below.Similar questions
- PS 9 Two films are shown on screen A and screen B at a cinema each evening. The numbers of people viewing the films on 12 consecutive evenings are shown in the back-to-back stem-and-leaf diagram. Screen A (12) Screen B (12) 8 037 34 7 6 4 0 534 74 1645678 92 71689 Key: 116|4 represents 61 viewers for A and 64 viewers for B A second stem-and-leaf diagram (with rows of the same width as the previous diagram) is drawn showing the total number of people viewing films at the cinema on each of these 12 evenings. Find the least and greatest possible number of rows that this second diagram could have. TIP On the evening when 30 people viewed films on screen A, there could have been as few as 37 or as many as 79 people viewing films on screen B.arrow_forwardQ.2.4 There are twelve (12) teams participating in a pub quiz. What is the probability of correctly predicting the top three teams at the end of the competition, in the correct order? Give your final answer as a fraction in its simplest form.arrow_forwardThe table below indicates the number of years of experience of a sample of employees who work on a particular production line and the corresponding number of units of a good that each employee produced last month. Years of Experience (x) Number of Goods (y) 11 63 5 57 1 48 4 54 5 45 3 51 Q.1.1 By completing the table below and then applying the relevant formulae, determine the line of best fit for this bivariate data set. Do NOT change the units for the variables. X y X2 xy Ex= Ey= EX2 EXY= Q.1.2 Estimate the number of units of the good that would have been produced last month by an employee with 8 years of experience. Q.1.3 Using your calculator, determine the coefficient of correlation for the data set. Interpret your answer. Q.1.4 Compute the coefficient of determination for the data set. Interpret your answer.arrow_forward
- Can you answer this question for mearrow_forwardTechniques QUAT6221 2025 PT B... TM Tabudi Maphoru Activities Assessments Class Progress lIE Library • Help v The table below shows the prices (R) and quantities (kg) of rice, meat and potatoes items bought during 2013 and 2014: 2013 2014 P1Qo PoQo Q1Po P1Q1 Price Ро Quantity Qo Price P1 Quantity Q1 Rice 7 80 6 70 480 560 490 420 Meat 30 50 35 60 1 750 1 500 1 800 2 100 Potatoes 3 100 3 100 300 300 300 300 TOTAL 40 230 44 230 2 530 2 360 2 590 2 820 Instructions: 1 Corall dawn to tha bottom of thir ceraan urina se se tha haca nariad in archerca antarand cubmit Q Search ENG US 口X 2025/05arrow_forwardThe table below indicates the number of years of experience of a sample of employees who work on a particular production line and the corresponding number of units of a good that each employee produced last month. Years of Experience (x) Number of Goods (y) 11 63 5 57 1 48 4 54 45 3 51 Q.1.1 By completing the table below and then applying the relevant formulae, determine the line of best fit for this bivariate data set. Do NOT change the units for the variables. X y X2 xy Ex= Ey= EX2 EXY= Q.1.2 Estimate the number of units of the good that would have been produced last month by an employee with 8 years of experience. Q.1.3 Using your calculator, determine the coefficient of correlation for the data set. Interpret your answer. Q.1.4 Compute the coefficient of determination for the data set. Interpret your answer.arrow_forward
- Q.3.2 A sample of consumers was asked to name their favourite fruit. The results regarding the popularity of the different fruits are given in the following table. Type of Fruit Number of Consumers Banana 25 Apple 20 Orange 5 TOTAL 50 Draw a bar chart to graphically illustrate the results given in the table.arrow_forwardQ.2.3 The probability that a randomly selected employee of Company Z is female is 0.75. The probability that an employee of the same company works in the Production department, given that the employee is female, is 0.25. What is the probability that a randomly selected employee of the company will be female and will work in the Production department? Q.2.4 There are twelve (12) teams participating in a pub quiz. What is the probability of correctly predicting the top three teams at the end of the competition, in the correct order? Give your final answer as a fraction in its simplest form.arrow_forwardQ.2.1 A bag contains 13 red and 9 green marbles. You are asked to select two (2) marbles from the bag. The first marble selected will not be placed back into the bag. Q.2.1.1 Construct a probability tree to indicate the various possible outcomes and their probabilities (as fractions). Q.2.1.2 What is the probability that the two selected marbles will be the same colour? Q.2.2 The following contingency table gives the results of a sample survey of South African male and female respondents with regard to their preferred brand of sports watch: PREFERRED BRAND OF SPORTS WATCH Samsung Apple Garmin TOTAL No. of Females 30 100 40 170 No. of Males 75 125 80 280 TOTAL 105 225 120 450 Q.2.2.1 What is the probability of randomly selecting a respondent from the sample who prefers Garmin? Q.2.2.2 What is the probability of randomly selecting a respondent from the sample who is not female? Q.2.2.3 What is the probability of randomly…arrow_forward
- Test the claim that a student's pulse rate is different when taking a quiz than attending a regular class. The mean pulse rate difference is 2.7 with 10 students. Use a significance level of 0.005. Pulse rate difference(Quiz - Lecture) 2 -1 5 -8 1 20 15 -4 9 -12arrow_forwardThe following ordered data list shows the data speeds for cell phones used by a telephone company at an airport: A. Calculate the Measures of Central Tendency from the ungrouped data list. B. Group the data in an appropriate frequency table. C. Calculate the Measures of Central Tendency using the table in point B. D. Are there differences in the measurements obtained in A and C? Why (give at least one justified reason)? I leave the answers to A and B to resolve the remaining two. 0.8 1.4 1.8 1.9 3.2 3.6 4.5 4.5 4.6 6.2 6.5 7.7 7.9 9.9 10.2 10.3 10.9 11.1 11.1 11.6 11.8 12.0 13.1 13.5 13.7 14.1 14.2 14.7 15.0 15.1 15.5 15.8 16.0 17.5 18.2 20.2 21.1 21.5 22.2 22.4 23.1 24.5 25.7 28.5 34.6 38.5 43.0 55.6 71.3 77.8 A. Measures of Central Tendency We are to calculate: Mean, Median, Mode The data (already ordered) is: 0.8, 1.4, 1.8, 1.9, 3.2, 3.6, 4.5, 4.5, 4.6, 6.2, 6.5, 7.7, 7.9, 9.9, 10.2, 10.3, 10.9, 11.1, 11.1, 11.6, 11.8, 12.0, 13.1, 13.5, 13.7, 14.1, 14.2, 14.7, 15.0, 15.1, 15.5,…arrow_forwardPEER REPLY 1: Choose a classmate's Main Post. 1. Indicate a range of values for the independent variable (x) that is reasonable based on the data provided. 2. Explain what the predicted range of dependent values should be based on the range of independent values.arrow_forward
arrow_back_ios
SEE MORE QUESTIONS
arrow_forward_ios
Recommended textbooks for you
 Functions and Change: A Modeling Approach to Coll...AlgebraISBN:9781337111348Author:Bruce Crauder, Benny Evans, Alan NoellPublisher:Cengage Learning
 Linear Algebra: A Modern IntroductionAlgebraISBN:9781285463247Author:David PoolePublisher:Cengage Learning
 College AlgebraAlgebraISBN:9781305115545Author:James Stewart, Lothar Redlin, Saleem WatsonPublisher:Cengage Learning
 Algebra and Trigonometry (MindTap Course List)AlgebraISBN:9781305071742Author:James Stewart, Lothar Redlin, Saleem WatsonPublisher:Cengage Learning
 Big Ideas Math A Bridge To Success Algebra 1: Stu...AlgebraISBN:9781680331141Author:HOUGHTON MIFFLIN HARCOURTPublisher:Houghton Mifflin Harcourt
Functions and Change: A Modeling Approach to Coll...
Algebra
ISBN:9781337111348
Author:Bruce Crauder, Benny Evans, Alan Noell
Publisher:Cengage Learning
Linear Algebra: A Modern Introduction
Algebra
ISBN:9781285463247
Author:David Poole
Publisher:Cengage Learning
College Algebra
Algebra
ISBN:9781305115545
Author:James Stewart, Lothar Redlin, Saleem Watson
Publisher:Cengage Learning
Algebra and Trigonometry (MindTap Course List)
Algebra
ISBN:9781305071742
Author:James Stewart, Lothar Redlin, Saleem Watson
Publisher:Cengage Learning
Big Ideas Math A Bridge To Success Algebra 1: Stu...
Algebra
ISBN:9781680331141
Author:HOUGHTON MIFFLIN HARCOURT
Publisher:Houghton Mifflin Harcourt
Correlation Vs Regression: Difference Between them with definition & Comparison Chart; Author: Key Differences;https://www.youtube.com/watch?v=Ou2QGSJVd0U;License: Standard YouTube License, CC-BY
Correlation and Regression: Concepts with Illustrative examples; Author: LEARN & APPLY : Lean and Six Sigma;https://www.youtube.com/watch?v=xTpHD5WLuoA;License: Standard YouTube License, CC-BY