
Videos
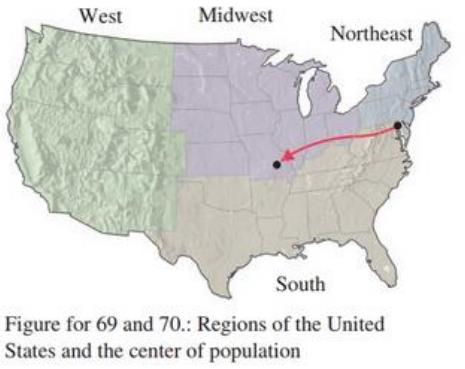
The population center of the 48 contiguous states of the United States is the point where a flat, rigid map of the contiguous states would balance if the location of each person was represented on the map by a weight of equal measure. In 1790, the population center was 23 miles east of Baltimore, Maryland. By 1990, the center had shifted about 800 miles west and 100 miles south to a point in southeast Missouri. To study this shifting population, the U.S. Census Bureau divides the states into four regions as shown in the figure. Problems 69 and 70 deal with population shifts among these regions.
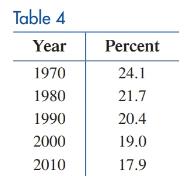
Population shifts. Table 3 gives the percentage of the U.S. population living in the south region during the indicated years.
The following transition matrix
(A) Let
(B) Construct a new table comparing the results from part (A) with the data in Table 4.
(C) According to this transition matrix, what percentage of the population will live in the northeast region in the long run?
Want to see the full answer?
Check out a sample textbook solution
Chapter 9 Solutions
Finite Mathematics for Business, Economics, Life Sciences and Social Sciences
Additional Math Textbook Solutions
Calculus for Business, Economics, Life Sciences, and Social Sciences (13th Edition)
Mathematics with Applications In the Management, Natural and Social Sciences (11th Edition)
A Problem Solving Approach to Mathematics for Elementary School Teachers (12th Edition)
Mathematics All Around (6th Edition)
Using & Understanding Mathematics: A Quantitative Reasoning Approach (7th Edition)
Excursions in Modern Mathematics (9th Edition)


- Determine the overall length, width, and height of the in Figure 2-4. All dimensions are in inches. length = ______. width =______. height =______.arrow_forwardThe number of gallons of milk sold each day at a grocery store ........... variable .arrow_forwardComplete the table by filling in the values of LB (lower boundaries) andarrow_forward
- an effect size of .17 would be consideredarrow_forwardA prize of $100, $200, $500, or $1000 will be randomly awarded to a game show contestant, with the probabilities of winning each prize shown in the table below. What is the expected value of the prize that will be awarded? Prize $100 $200 $500 $1000 Probabilityarrow_forwardCan you please answer the problem below: Thanksarrow_forward
- 4. Match each description with the appropriate type of graph. Some graph types can be used more than once. Description a) Displays discrete data in separate columns. Graph Bar graph Histogram Circle graph Stem and leaf plot Pictograph b) Organizes data by representing part of each number as a stem and the other part as a leaf. c) Uses pictures or symbols to represent data. d) Displays data as a percent of the whole. e) Uses proportional areas of the bars to show frequencies of the values of the variables. f) Represents data using a circle that has been divided into sectors. g) Represents nominal data, such as days of the week.arrow_forwardA reseacher desires to know if the age of a child is related to the number of cavities he or she has.arrow_forwardThe variable "Gender" can be regarded as being, in general a. qualitative and ratio level b. quantitative C. qualitative and nominal level d. qualitative and ordinal levelarrow_forward
- Select the answer that best describes what is being asked. Consider the given table below: 1. How much is the service cost if there is only one teller in the system? a. $222.00 b. $166.50 c. $111.00 d. $55.50 2. How much is the service cost if there are four tellers in the system? a. $222.00 b. $166.50 c. $111.00 d. $55.50 3. What is the total expected cost if there are five tellers in the system? a. $1927.50 b. $901.50 c. $1414.50 d. $1220.40 4. What is the total expected cost if there are three tellers in the system? a. $1927.50 b. $901.50 c. $1414.50 d. $1220.40arrow_forwardArea 2. A fugitive has escaped in a train wreck. The police believe he could not have traveled more than 7 miles. In any direction from the wreck. How many square miles 3. must be searched?arrow_forwardLomput e Or Cosco da.arrow_forward
 Mathematics For Machine TechnologyAdvanced MathISBN:9781337798310Author:Peterson, John.Publisher:Cengage Learning,
 Algebra: Structure And Method, Book 1AlgebraISBN:9780395977224Author:Richard G. Brown, Mary P. Dolciani, Robert H. Sorgenfrey, William L. ColePublisher:McDougal Littell
 Glencoe Algebra 1, Student Edition, 9780079039897...AlgebraISBN:9780079039897Author:CarterPublisher:McGraw Hill
 Holt Mcdougal Larson Pre-algebra: Student Edition...AlgebraISBN:9780547587776Author:HOLT MCDOUGALPublisher:HOLT MCDOUGAL