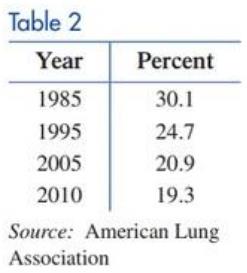
Smoking. Table 2 gives the percentage of U.S. adults who were smokers in the given year.

The following transition matrix
(A) Let
(B) Construct a new table comparing the results from part (A) with the data in Table 2.
(C) According to this transition matrix, what percentage of the adult U.S. population will be smokers in the long run?
Want to see the full answer?
Check out a sample textbook solution
Chapter 9 Solutions
Finite Mathematics for Business, Economics, Life Sciences and Social Sciences
Additional Math Textbook Solutions
Introductory Statistics
College Algebra (7th Edition)
Elementary Statistics (13th Edition)
Algebra and Trigonometry (6th Edition)
Thinking Mathematically (6th Edition)
Calculus: Early Transcendentals (2nd Edition)
- 1: Stanley Smothers receives tips from customers as a standard component of his weekly pay. He was paid $5.10/hour by his employer and received $305 in tips during the most recent 41-hour workweek. Gross Pay = $ 2: Arnold Weiner receives tips from customers as a standard component of his weekly pay. He was paid $4.40/hour by his employer and received $188 in tips during the most recent 47-hour workweek. Gross Pay = $ 3: Katherine Shaw receives tips from customers as a standard component of her weekly pay. She was paid $2.20/hour by her employer and received $553 in tips during the most recent 56-hour workweek. Gross Pay = $ 4: Tracey Houseman receives tips from customers as a standard component of her weekly pay. She was paid $3.90/hour by her employer and received $472 in tips during the most recent 45-hour workweek. Gross Pay = $arrow_forward8 √x+...∞ If, y = x + √ x + √x + √x +. then y(2) =? 00arrow_forward8 √x+...∞ If, y = x + √ x + √x + √x +. then y(2) =? 00arrow_forward
- Could you explain this using the formula I attached and polar coordinatesarrow_forwardHow many different passwords are there that contain only digits and lower-case letters and satisfy the given restrictions? (a) Length is 6 and the password must contain at least one digit. (b) Length is 6 and the password must contain at least one digit and at least one letter.arrow_forward1: Neil Mitchell earns $11/hour. During the most recent week, he received a discretionary bonus of $7,200 and worked 43 hours. Gross Pay: $ 7,689.50 2: Francine Palmer earns $7.90/hour. During the most recent week, she received a nondiscretionary bonus of $2,450 and worked 45 hours. Gross Pay: $ 2,825.25 3: Martin Green earns $11.10/hour. During the most recent week, he received a nondiscretionary bonus of $1,360 and worked 51 hours. Gross Pay: $ 1,987.15 4: Melvin Waxman earns $17.60/hour. During the most recent week, he received a nondiscretionary bonus of $440 and worked 56 hours. Gross Pay: $ 1,425.60arrow_forward
- Obtain the linear equation for trend for time series with St² = 140, Ey = 16.91 and Σty= 62.02, m n = 7arrow_forward1: Kevin Williams earns a weekly wage of $740. During the most recent week, he worked 42 hours. Regular Wage Rate = $ 18.50 Overtime Wage Rate = $ 27.75 2: Charles Joyner earns a biweekly wage of $2,720. During the most recent week, he worked 45 hours. Regular Wage Rate = $ Overtime Wage Rate = $_ 34.00 51.00 3: Julio Valdez earns an annual salary of $81,000. During the most recent week, he worked 44 hours. Regular Wage Rate = $ Overtime Wage Rate = $ 38.94 58.41 4: Bridget Stein earns a monthly salary of $6,200. During the most recent week, she worked 56 hours. Regular Wage Rate = $ 27.50 Overtime Wage Rate = $ 41.25 5: Betsy Cranston earns a semimonthly salary of $2,200. During the most recent week, she worked 49 hours. Regular Wage Rate = $ Overtime Wage Rate = $_ 1,100.00 41.25arrow_forwardIf you are using chatgpt leave it plz Already got wrong chatgpt answer .arrow_forward
 Big Ideas Math A Bridge To Success Algebra 1: Stu...AlgebraISBN:9781680331141Author:HOUGHTON MIFFLIN HARCOURTPublisher:Houghton Mifflin Harcourt
 Glencoe Algebra 1, Student Edition, 9780079039897...AlgebraISBN:9780079039897Author:CarterPublisher:McGraw Hill
 Linear Algebra: A Modern IntroductionAlgebraISBN:9781285463247Author:David PoolePublisher:Cengage Learning
 Functions and Change: A Modeling Approach to Coll...AlgebraISBN:9781337111348Author:Bruce Crauder, Benny Evans, Alan NoellPublisher:Cengage Learning
 Trigonometry (MindTap Course List)TrigonometryISBN:9781337278461Author:Ron LarsonPublisher:Cengage Learning


