
Concept explainers
Videos
(a)
To sketch: The graph for two options for the dish one that opens up and one that opens left.
(a)
Answer to Problem 33PPS
The graphs of the dish that opens up and one that opens left are shown in figure (1) and (2).
Explanation of Solution
Given:
The diameter of the dish is 146 feet.
The focus is 48 feet from the vertex.
Calculation:
Assume that the vertex of the parabola is at origin
The sketch of the dish opening up is as follows.
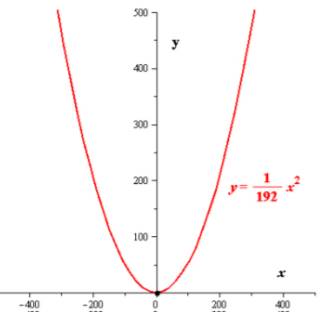
Figure (1)
The sketch of the dish opening left is as follows.
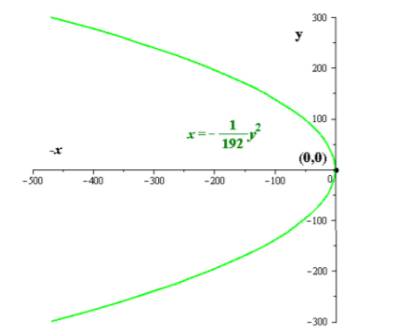
Figure (2)
Therefore, the graphs of the dish that opens up and one that opens left are shown in figure (1) and (2).
(b)
To write: The two equations that model the sketches in previous part.
(b)
Answer to Problem 33PPS
The equations are
Explanation of Solution
Given:
The diameter of the dish is 146 feet.
The focus is 48 feet from the vertex.
Calculation:
Assume that the vertex of the parabola is at origin
The distance between focus and vertex is equal to 48 feet. Then
The parabola opening up will be of the form
Substitute
The parabola opening left will be of the form
Substitute
Therefore, the equations are
(c)
To find: Whether it is matter to find the equation that must be used to find the depth of the dish.
(c)
Answer to Problem 33PPS
No, it does not matter which equation is used to find the depth of the dish.
Explanation of Solution
Given:
The diameter of the dish is 146 feet.
The focus is 48 feet from the vertex.
Calculation:
Two graphs are identical in all respect except for the direction in which they open.
Therefore, no, it does not matter which equation is used to find the depth of the dish.
Chapter 9 Solutions
Glencoe Algebra 2 Student Edition C2014
Additional Math Textbook Solutions
University Calculus: Early Transcendentals (4th Edition)
Elementary Statistics: Picturing the World (7th Edition)
Basic Business Statistics, Student Value Edition
A First Course in Probability (10th Edition)
Introductory Statistics
A Problem Solving Approach To Mathematics For Elementary School Teachers (13th Edition)


- A research study in the year 2009 found that there were 2760 coyotes in a given region. The coyote population declined at a rate of 5.8% each year. How many fewer coyotes were there in 2024 than in 2015? Explain in at least one sentence how you solved the problem. Show your work. Round your answer to the nearest whole number.arrow_forwardAnswer the following questions related to the following matrix A = 3 ³).arrow_forwardExplain the following termsarrow_forward
- Solve questions by Course Name (Ordinary Differential Equations II 2)arrow_forwardplease Solve questions by Course Name( Ordinary Differential Equations II 2)arrow_forwardInThe Northern Lights are bright flashes of colored light between 50 and 200 miles above Earth. Suppose a flash occurs 150 miles above Earth. What is the measure of arc BD, the portion of Earth from which the flash is visible? (Earth’s radius is approximately 4000 miles.)arrow_forward
- e). n! (n - 1)!arrow_forwardSuppose you flip a fair two-sided coin four times and record the result. a). List the sample space of this experiment. That is, list all possible outcomes that could occur when flipping a fair two-sided coin four total times. Assume the two sides of the coin are Heads (H) and Tails (T).arrow_forwarde). n! (n - 1)!arrow_forward
 Algebra and Trigonometry (6th Edition)AlgebraISBN:9780134463216Author:Robert F. BlitzerPublisher:PEARSON
 Contemporary Abstract AlgebraAlgebraISBN:9781305657960Author:Joseph GallianPublisher:Cengage Learning
 Linear Algebra: A Modern IntroductionAlgebraISBN:9781285463247Author:David PoolePublisher:Cengage Learning
 Algebra And Trigonometry (11th Edition)AlgebraISBN:9780135163078Author:Michael SullivanPublisher:PEARSON
 Introduction to Linear Algebra, Fifth EditionAlgebraISBN:9780980232776Author:Gilbert StrangPublisher:Wellesley-Cambridge Press
 College Algebra (Collegiate Math)AlgebraISBN:9780077836344Author:Julie Miller, Donna GerkenPublisher:McGraw-Hill Education