
Pearson eText for Elementary Statistics: Picturing the World -- Instant Access (Pearson+)
7th Edition
ISBN: 9780137504329
Author: Ron Larson, Betsy Farber
Publisher: PEARSON+
expand_more
expand_more
format_list_bulleted
Concept explainers
Videos
Textbook Question
Chapter 9.1, Problem 29E
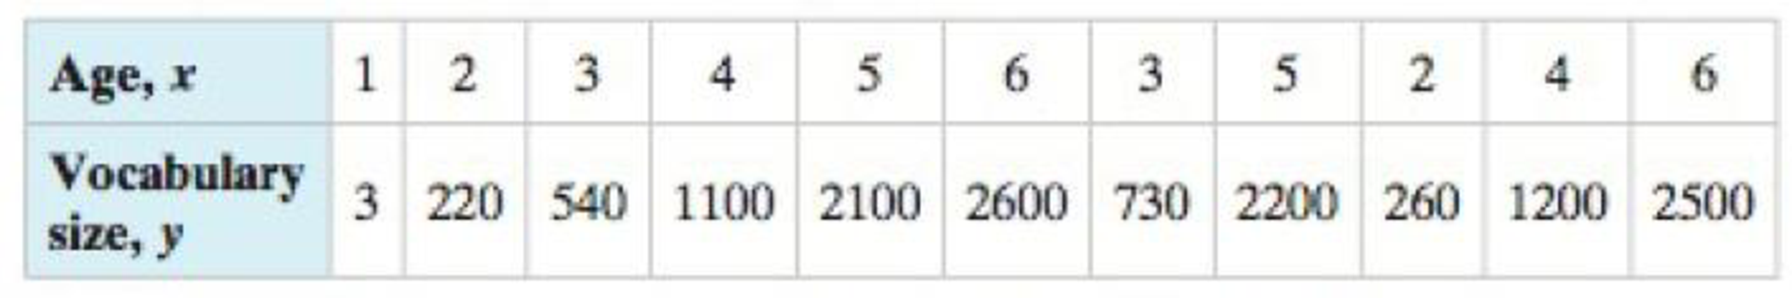
In Exercise 23, add data for a child who is 6 years old and has a vocabulary size of 900 words to the data set. Describe how this affects the
23. Age and Vocabulary The ages (in years) of 11 children and the numbers of words in their vocabulary
Expert Solution & Answer
Want to see the full answer?
Check out a sample textbook solution
Students have asked these similar questions
iid
1. The CLT provides an approximate sampling distribution for the arithmetic average Ỹ of a
random sample Y₁, . . ., Yn f(y). The parameters of the approximate sampling distribution
depend on the mean and variance of the underlying random variables (i.e., the population
mean and variance). The approximation can be written to emphasize this, using the expec-
tation and variance of one of the random variables in the sample instead of the parameters
μ, 02:
YNEY,
· (1
(EY,, varyi
n
For the following population distributions f, write the approximate distribution of the sample
mean.
(a) Exponential with rate ẞ: f(y) = ß exp{−ßy}
1
(b) Chi-square with degrees of freedom: f(y) = ( 4 ) 2 y = exp { — ½/ }
г(
(c) Poisson with rate λ: P(Y = y) = exp(-\}
>
y!
y²
2. Let Y₁,……., Y be a random sample with common mean μ and common variance σ². Use the
CLT to write an expression approximating the CDF P(Ỹ ≤ x) in terms of µ, σ² and n, and
the standard normal CDF Fz(·).
math
Chapter 9 Solutions
Pearson eText for Elementary Statistics: Picturing the World -- Instant Access (Pearson+)
Ch. 9.1 - A director of alumni affairs at a small college...Ch. 9.1 - A researcher conducts a study to determine whether...Ch. 9.1 - Consider the data on page 469 on the salaries and...Ch. 9.1 - Calculate the correlation coefficient for the...Ch. 9.1 - Use technology to calculate the correlation...Ch. 9.1 - In Try It Yourself 4, you calculated the...Ch. 9.1 - In Try It Yourself 5, you calculated the...Ch. 9.1 - Two variables have a positive linear correlation....Ch. 9.1 - Describe the range of values for the correlation...Ch. 9.1 - What does the sample correlation coefficient r...
Ch. 9.1 - Give examples of two variables that have perfect...Ch. 9.1 - Explain how to determine whether a sample...Ch. 9.1 - Discuss the difference between r and p.Ch. 9.1 - What are the null and alternate hypotheses for a...Ch. 9.1 - In your own words, what does it mean to say...Ch. 9.1 - Graphical Analysis In Exercises 912, determine...Ch. 9.1 - Graphical Analysis In Exercises 912, determine...Ch. 9.1 - Graphical Analysis In Exercises 912, determine...Ch. 9.1 - Graphical Analysis In Exercises 912, determine...Ch. 9.1 - In Exercises 13 and 14, identify the explanatory...Ch. 9.1 - In Exercises 13 and 14, identify the explanatory...Ch. 9.1 - Graphical Analysis In Exercises 1518, the scatter...Ch. 9.1 - Graphical Analysis In Exercises 1518, the scatter...Ch. 9.1 - Graphical Analysis In Exercises 1518, the scatter...Ch. 9.1 - Graphical Analysis In Exercises 1518, the scatter...Ch. 9.1 - In Exercises 1922, two variables are given that...Ch. 9.1 - In Exercises 1922, two variables are given that...Ch. 9.1 - In Exercises 1922, two variables are given that...Ch. 9.1 - In Exercises 1922, two variables are given that...Ch. 9.1 - Constructing a Scatter Plot and Determining...Ch. 9.1 - Constructing a Scatter Plot and Determining...Ch. 9.1 - Constructing a Scatter Plot and Determining...Ch. 9.1 - Constructing a Scatter Plot and Determining...Ch. 9.1 - Constructing a Scatter Plot and Determining...Ch. 9.1 - Constructing a Scatter Plot and Determining...Ch. 9.1 - In Exercise 23, add data for a child who is 6...Ch. 9.1 - In Exercise 24, remove the data for the girl who...Ch. 9.1 - In Exercise 25, remove the data for the...Ch. 9.1 - In Exercise 26, add data for an international...Ch. 9.1 - The t-Test for Correlation Coefficients In...Ch. 9.1 - The t-Test for Correlation Coefficients In...Ch. 9.1 - The t-Test for Correlation Coefficients In...Ch. 9.1 - The t-Test for Correlation Coefficients In...Ch. 9.1 - Interchanging x and y In Exercise 26, let the time...Ch. 9.1 - Generate a new data set. Using your knowledge of...Ch. 9.1 - Describe how to create a data set with a value of...Ch. 9.1 - Describe how to create a data set with a value of...Ch. 9.1 - Try to create a data set with a value of r that is...Ch. 9.2 - Find the equation of the regression line for the...Ch. 9.2 - Use technology to find the equation of the...Ch. 9.2 - The regression equation for the Old Faithful data...Ch. 9.2 - What is a residual? Explain when a residual is...Ch. 9.2 - Two variables have a positive linear correlation....Ch. 9.2 - Explain how to predict y-values using the equation...Ch. 9.2 - For a set of data and a corresponding regression...Ch. 9.2 - In order to predict y-values using the equation of...Ch. 9.2 - Why is it not appropriate to use a regression line...Ch. 9.2 - In Exercises 712, match the description in the...Ch. 9.2 - In Exercises 712, match the description in the...Ch. 9.2 - In Exercises 712, match the description in the...Ch. 9.2 - In Exercises 712, match the description in the...Ch. 9.2 - In Exercises 712, match the description in the...Ch. 9.2 - In Exercises 712, match the description in the...Ch. 9.2 - Graphical Analysis In Exercises 1316, match the...Ch. 9.2 - Graphical Analysis In Exercises 1316, match the...Ch. 9.2 - Graphical Analysis In Exercises 1316, match the...Ch. 9.2 - Graphical Analysis In Exercises 1316, match the...Ch. 9.2 - Finding the Equation of a Regression Line In...Ch. 9.2 - Finding the Equation of a Regression Line In...Ch. 9.2 - Finding the Equation of a Regression Line In...Ch. 9.2 - Finding the Equation of a Regression Line In...Ch. 9.2 - Finding the Equation of a Regression Line In...Ch. 9.2 - Finding the Equation of a Regression Line In...Ch. 9.2 - Finding the Equation of a Regression Line In...Ch. 9.2 - Finding the Equation of a Regression Line In...Ch. 9.2 - Finding the Equation of a Regression Line In...Ch. 9.2 - Finding the Equation of a Regression Line In...Ch. 9.2 - Registered Nurse Salaries In Exercises 2730, use...Ch. 9.2 - Registered Nurse Salaries In Exercises 2730, use...Ch. 9.2 - Registered Nurse Salaries In Exercises 2730, use...Ch. 9.2 - Registered Nurse Salaries In Exercises 2730, use...Ch. 9.2 - Interchanging X and y In Exercises 31 and 32,...Ch. 9.2 - Interchanging X and y In Exercises 31 and 32,...Ch. 9.2 - In Exercises 33 and 34, (a) find the equation of...Ch. 9.2 - In Exercises 33 and 34, (a) find the equation of...Ch. 9.2 - In Exercises 35 and 36, (a) construct a scatter...Ch. 9.2 - Prob. 36ECh. 9.2 - Prob. 37ECh. 9.2 - Prob. 38ECh. 9.2 - Prob. 39ECh. 9.2 - Prob. 40ECh. 9.2 - Prob. 41ECh. 9.2 - Prob. 42ECh. 9.2 - Prob. 43ECh. 9.2 - Prob. 44ECh. 9.2 - Prob. 45ECh. 9.2 - Prob. 46ECh. 9.2 - Prob. 47ECh. 9.2 - Prob. 48ECh. 9.2 - Prob. 1ACh. 9.2 - Prob. 2ACh. 9.2 - Prob. 3ACh. 9.2 - Prob. 4ACh. 9.3 - The correlation coefficient for the Old Faithful...Ch. 9.3 - Prob. 2TYCh. 9.3 - Using the results of Example 2, construct a 95%...Ch. 9.3 - Graphical Analysis In Exercises 13, use the...Ch. 9.3 - Graphical Analysis In Exercises 13, use the...Ch. 9.3 - Graphical Analysis In Exercises 13, use the...Ch. 9.3 - The coefficient of determination r2 is the ratio...Ch. 9.3 - What is the coefficient of determination for two...Ch. 9.3 - Two variables have a bivariate normal...Ch. 9.3 - In Exercises 710, use the value of the correlation...Ch. 9.3 - In Exercises 710, use the value of the correlation...Ch. 9.3 - In Exercises 710, use the value of the correlation...Ch. 9.3 - In Exercises 710, use the value of the correlation...Ch. 9.3 - Finding the Coefficient of Determination and the...Ch. 9.3 - Finding the Coefficient of Determination and the...Ch. 9.3 - Finding the Coefficient of Determination and the...Ch. 9.3 - Finding the Coefficient of Determination and the...Ch. 9.3 - Finding the Coefficient of Determination and the...Ch. 9.3 - Finding the Coefficient of Determination and the...Ch. 9.3 - Finding the Coefficient of Determination and the...Ch. 9.3 - Finding the Coefficient of Determination and the...Ch. 9.3 - Finding the Coefficient of Determination and the...Ch. 9.3 - Finding the Coefficient of Determination and the...Ch. 9.3 - Constructing and Interpreting a Prediction...Ch. 9.3 - Constructing and Interpreting a Prediction...Ch. 9.3 - Constructing and Interpreting a Prediction...Ch. 9.3 - Constructing and Interpreting a Prediction...Ch. 9.3 - STEM Employment and Mean Wage The table shows the...Ch. 9.3 - Constructing and Interpreting a Prediction...Ch. 9.3 - Constructing and Interpreting a Prediction...Ch. 9.3 - Fund Assets The table shows the total assets (in...Ch. 9.3 - New-Vehicle Sales The table shows the numbers of...Ch. 9.3 - New-Vehicle Sales The table shows the numbers of...Ch. 9.3 - Old Vehicles In Exercises 3134, use the figure...Ch. 9.3 - Old Vehicles In Exercises 3134, use the figure...Ch. 9.3 - Old Vehicles In Exercises 3134, use the figure...Ch. 9.3 - Old Vehicles In Exercises 3134, use the figure...Ch. 9.3 - Prob. 35ECh. 9.3 - Prob. 36ECh. 9.3 - Prob. 37ECh. 9.3 - In Exercises 37 and 38, construct the indicated...Ch. 9.4 - A statistics professor wants to determine how...Ch. 9.4 - Use the regression equation found in Try It...Ch. 9.4 - Predicting y-Values In Exercises 14, use the...Ch. 9.4 - Predicting y-Values In Exercises 14, use the...Ch. 9.4 - Prob. 3ECh. 9.4 - Predicting y-Values In Exercises 14, use the...Ch. 9.4 - Finding a Multiple Regression Equation In...Ch. 9.4 - Finding a Multiple Regression Equation In...Ch. 9.4 - In Exercises 7 and 8, calculate r2adi and...Ch. 9.4 - In Exercises 7 and 8, calculate r2adi and...Ch. 9 - In Exercises 14, (a) display the data in a scatter...Ch. 9 - In Exercises 14, (a) display the data in a scatter...Ch. 9 - In Exercises 14, (a) display the data in a scatter...Ch. 9 - In Exercises 14, (a) display the data in a scatter...Ch. 9 - Prob. 9.1.5RECh. 9 - Prob. 9.1.6RECh. 9 - Prob. 9.1.7RECh. 9 - Prob. 9.1.8RECh. 9 - In Exercises 912, find the equation of the...Ch. 9 - Prob. 9.2.10RECh. 9 - In Exercises 912, find the equation of the...Ch. 9 - Prob. 9.2.12RECh. 9 - In Exercises 1316, use the value of the...Ch. 9 - Prob. 9.3.14RECh. 9 - Prob. 9.3.15RECh. 9 - Prob. 9.3.16RECh. 9 - Prob. 9.3.17RECh. 9 - Prob. 9.3.18RECh. 9 - Prob. 9.3.19RECh. 9 - Prob. 9.3.20RECh. 9 - Prob. 9.3.21RECh. 9 - In Exercises 1924, construct the indicated...Ch. 9 - Prob. 9.3.23RECh. 9 - Prob. 9.3.24RECh. 9 - Prob. 9.4.25RECh. 9 - Prob. 9.4.26RECh. 9 - Prob. 9.4.27RECh. 9 - Prob. 9.4.28RECh. 9 - Prob. 1CQCh. 9 - For Exercises 18, use the data in the table, which...Ch. 9 - Prob. 3CQCh. 9 - Prob. 4CQCh. 9 - Prob. 5CQCh. 9 - Prob. 6CQCh. 9 - Prob. 7CQCh. 9 - For Exercises 18, use the data in the table, which...Ch. 9 - Prob. 9CQCh. 9 - Net Sales The equation used to predict the net...Ch. 9 - For Exercises 29, use the data in the table, which...Ch. 9 - For Exercises 29, use the data in the table, which...Ch. 9 - For Exercises 29, use the data in the table, which...Ch. 9 - For Exercises 29, use the data in the table, which...Ch. 9 - For Exercises 29, use the data in the table, which...Ch. 9 - For Exercises 29, use the data in the table, which...Ch. 9 - For Exercises 29, use the data in the table, which...Ch. 9 - For Exercises 29, use the data in the table, which...Ch. 9 - Analyzing the Data (a) The data in the table show...Ch. 9 - Making Predictions Construct a 95% prediction...Ch. 9 - Prob. 1TCh. 9 - Prob. 2TCh. 9 - Prob. 3TCh. 9 - Prob. 4TCh. 9 - Prob. 5TCh. 9 - Use technology to find the multiple regression...Ch. 9 - Prob. 7T
Knowledge Booster


Learn more about
Need a deep-dive on the concept behind this application? Look no further. Learn more about this topic, statistics and related others by exploring similar questions and additional content below.Similar questions
- Compute the median of the following data. 32, 41, 36, 42, 29, 30, 40, 22, 25, 37arrow_forwardTask Description: Read the following case study and answer the questions that follow. Ella is a 9-year-old third-grade student in an inclusive classroom. She has been diagnosed with Emotional and Behavioural Disorder (EBD). She has been struggling academically and socially due to challenges related to self-regulation, impulsivity, and emotional outbursts. Ella's behaviour includes frequent tantrums, defiance toward authority figures, and difficulty forming positive relationships with peers. Despite her challenges, Ella shows an interest in art and creative activities and demonstrates strong verbal skills when calm. Describe 2 strategies that could be implemented that could help Ella regulate her emotions in class (4 marks) Explain 2 strategies that could improve Ella’s social skills (4 marks) Identify 2 accommodations that could be implemented to support Ella academic progress and provide a rationale for your recommendation.(6 marks) Provide a detailed explanation of 2 ways…arrow_forwardQuestion 2: When John started his first job, his first end-of-year salary was $82,500. In the following years, he received salary raises as shown in the following table. Fill the Table: Fill the following table showing his end-of-year salary for each year. I have already provided the end-of-year salaries for the first three years. Calculate the end-of-year salaries for the remaining years using Excel. (If you Excel answer for the top 3 cells is not the same as the one in the following table, your formula / approach is incorrect) (2 points) Geometric Mean of Salary Raises: Calculate the geometric mean of the salary raises using the percentage figures provided in the second column named “% Raise”. (The geometric mean for this calculation should be nearly identical to the arithmetic mean. If your answer deviates significantly from the mean, it's likely incorrect. 2 points) Starting salary % Raise Raise Salary after raise 75000 10% 7500 82500 82500 4% 3300…arrow_forward
- I need help with this problem and an explanation of the solution for the image described below. (Statistics: Engineering Probabilities)arrow_forwardI need help with this problem and an explanation of the solution for the image described below. (Statistics: Engineering Probabilities)arrow_forward310015 K Question 9, 5.2.28-T Part 1 of 4 HW Score: 85.96%, 49 of 57 points Points: 1 Save of 6 Based on a poll, among adults who regret getting tattoos, 28% say that they were too young when they got their tattoos. Assume that six adults who regret getting tattoos are randomly selected, and find the indicated probability. Complete parts (a) through (d) below. a. Find the probability that none of the selected adults say that they were too young to get tattoos. 0.0520 (Round to four decimal places as needed.) Clear all Final check Feb 7 12:47 US Oarrow_forward
- how could the bar graph have been organized differently to make it easier to compare opinion changes within political partiesarrow_forwardDraw a picture of a normal distribution with mean 70 and standard deviation 5.arrow_forwardWhat do you guess are the standard deviations of the two distributions in the previous example problem?arrow_forward
- Please answer the questionsarrow_forward30. An individual who has automobile insurance from a certain company is randomly selected. Let Y be the num- ber of moving violations for which the individual was cited during the last 3 years. The pmf of Y isy | 1 2 4 8 16p(y) | .05 .10 .35 .40 .10 a.Compute E(Y).b. Suppose an individual with Y violations incurs a surcharge of $100Y^2. Calculate the expected amount of the surcharge.arrow_forward24. An insurance company offers its policyholders a num- ber of different premium payment options. For a ran- domly selected policyholder, let X = the number of months between successive payments. The cdf of X is as follows: F(x)=0.00 : x < 10.30 : 1≤x<30.40 : 3≤ x < 40.45 : 4≤ x <60.60 : 6≤ x < 121.00 : 12≤ x a. What is the pmf of X?b. Using just the cdf, compute P(3≤ X ≤6) and P(4≤ X).arrow_forward
arrow_back_ios
SEE MORE QUESTIONS
arrow_forward_ios
Recommended textbooks for you
 Glencoe Algebra 1, Student Edition, 9780079039897...AlgebraISBN:9780079039897Author:CarterPublisher:McGraw Hill
 Big Ideas Math A Bridge To Success Algebra 1: Stu...AlgebraISBN:9781680331141Author:HOUGHTON MIFFLIN HARCOURTPublisher:Houghton Mifflin Harcourt
 Holt Mcdougal Larson Pre-algebra: Student Edition...AlgebraISBN:9780547587776Author:HOLT MCDOUGALPublisher:HOLT MCDOUGAL
Glencoe Algebra 1, Student Edition, 9780079039897...
Algebra
ISBN:9780079039897
Author:Carter
Publisher:McGraw Hill
Big Ideas Math A Bridge To Success Algebra 1: Stu...
Algebra
ISBN:9781680331141
Author:HOUGHTON MIFFLIN HARCOURT
Publisher:Houghton Mifflin Harcourt
Holt Mcdougal Larson Pre-algebra: Student Edition...
Algebra
ISBN:9780547587776
Author:HOLT MCDOUGAL
Publisher:HOLT MCDOUGAL
Correlation Vs Regression: Difference Between them with definition & Comparison Chart; Author: Key Differences;https://www.youtube.com/watch?v=Ou2QGSJVd0U;License: Standard YouTube License, CC-BY
Correlation and Regression: Concepts with Illustrative examples; Author: LEARN & APPLY : Lean and Six Sigma;https://www.youtube.com/watch?v=xTpHD5WLuoA;License: Standard YouTube License, CC-BY