
Pearson eText for Elementary Statistics: Picturing the World -- Instant Access (Pearson+)
7th Edition
ISBN: 9780137504329
Author: Ron Larson, Betsy Farber
Publisher: PEARSON+
expand_more
expand_more
format_list_bulleted
Concept explainers
Videos
Textbook Question
Chapter 9.3, Problem 18E
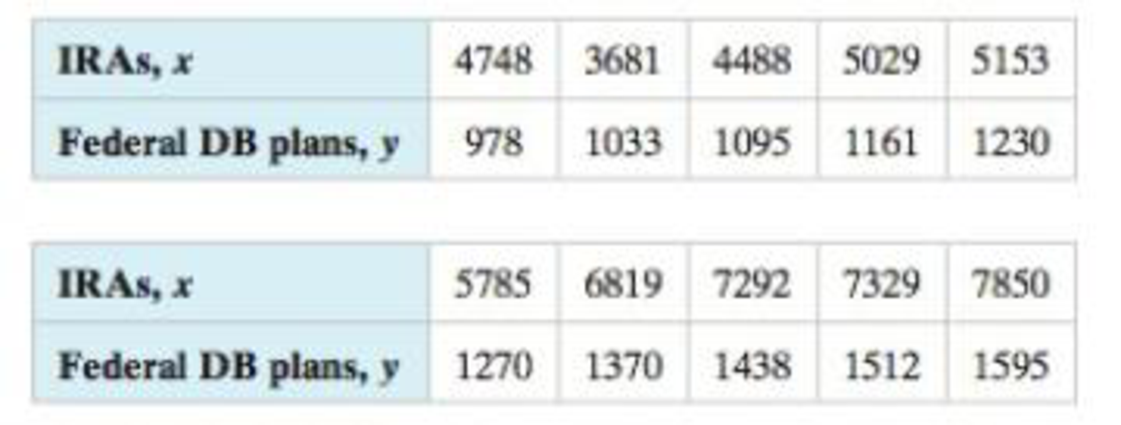
Finding the Coefficient of Determination and the Standard Error of Estimate In Exercises 11–20, use the data to (a) find the coefficient of determination r and interpret the result, and (b) find the standard error of estimate se, and interpret the result.
18. Fund Assets The table shows the total assets (in billions of dollars) of individual retirement accounts (IRAs) and federal defined benefit (DB) plans for ten years. The equation of the regression line is ŷ = 0.140x + 453.959. (Source: Investment Company Institute)
Expert Solution & Answer
Want to see the full answer?
Check out a sample textbook solution
Students have asked these similar questions
T1.4: Let ẞ(G) be the minimum size of a vertex cover, a(G) be the maximum size of an
independent set and m(G) = |E(G)|.
(i) Prove that if G is triangle free (no induced K3) then m(G) ≤ a(G)B(G). Hints - The
neighborhood of a vertex in a triangle free graph must be independent; all edges have at least
one end in a vertex cover.
(ii) Show that all graphs of order n ≥ 3 and size m> [n2/4] contain a triangle. Hints - you
may need to use either elementary calculus or the arithmetic-geometric mean inequality.
We consider the one-period model studied in class as an example. Namely, we assumethat the current stock price is S0 = 10. At time T, the stock has either moved up toSt = 12 (with probability p = 0.6) or down towards St = 8 (with probability 1−p = 0.4).We consider a call option on this stock with maturity T and strike price K = 10. Theinterest rate on the money market is zero.As in class, we assume that you, as a customer, are willing to buy the call option on100 shares of stock for $120. The investor, who sold you the option, can adopt one of thefollowing strategies: Strategy 1: (seen in class) Buy 50 shares of stock and borrow $380. Strategy 2: Buy 55 shares of stock and borrow $430. Strategy 3: Buy 60 shares of stock and borrow $480. Strategy 4: Buy 40 shares of stock and borrow $280.(a) For each of strategies 2-4, describe the value of the investor’s portfolio at time 0,and at time T for each possible movement of the stock.(b) For each of strategies 2-4, does the investor have…
Negate the following compound statement using De Morgans's laws.
Chapter 9 Solutions
Pearson eText for Elementary Statistics: Picturing the World -- Instant Access (Pearson+)
Ch. 9.1 - A director of alumni affairs at a small college...Ch. 9.1 - A researcher conducts a study to determine whether...Ch. 9.1 - Consider the data on page 469 on the salaries and...Ch. 9.1 - Calculate the correlation coefficient for the...Ch. 9.1 - Use technology to calculate the correlation...Ch. 9.1 - In Try It Yourself 4, you calculated the...Ch. 9.1 - In Try It Yourself 5, you calculated the...Ch. 9.1 - Two variables have a positive linear correlation....Ch. 9.1 - Describe the range of values for the correlation...Ch. 9.1 - What does the sample correlation coefficient r...
Ch. 9.1 - Give examples of two variables that have perfect...Ch. 9.1 - Explain how to determine whether a sample...Ch. 9.1 - Discuss the difference between r and p.Ch. 9.1 - What are the null and alternate hypotheses for a...Ch. 9.1 - In your own words, what does it mean to say...Ch. 9.1 - Graphical Analysis In Exercises 912, determine...Ch. 9.1 - Graphical Analysis In Exercises 912, determine...Ch. 9.1 - Graphical Analysis In Exercises 912, determine...Ch. 9.1 - Graphical Analysis In Exercises 912, determine...Ch. 9.1 - In Exercises 13 and 14, identify the explanatory...Ch. 9.1 - In Exercises 13 and 14, identify the explanatory...Ch. 9.1 - Graphical Analysis In Exercises 1518, the scatter...Ch. 9.1 - Graphical Analysis In Exercises 1518, the scatter...Ch. 9.1 - Graphical Analysis In Exercises 1518, the scatter...Ch. 9.1 - Graphical Analysis In Exercises 1518, the scatter...Ch. 9.1 - In Exercises 1922, two variables are given that...Ch. 9.1 - In Exercises 1922, two variables are given that...Ch. 9.1 - In Exercises 1922, two variables are given that...Ch. 9.1 - In Exercises 1922, two variables are given that...Ch. 9.1 - Constructing a Scatter Plot and Determining...Ch. 9.1 - Constructing a Scatter Plot and Determining...Ch. 9.1 - Constructing a Scatter Plot and Determining...Ch. 9.1 - Constructing a Scatter Plot and Determining...Ch. 9.1 - Constructing a Scatter Plot and Determining...Ch. 9.1 - Constructing a Scatter Plot and Determining...Ch. 9.1 - In Exercise 23, add data for a child who is 6...Ch. 9.1 - In Exercise 24, remove the data for the girl who...Ch. 9.1 - In Exercise 25, remove the data for the...Ch. 9.1 - In Exercise 26, add data for an international...Ch. 9.1 - The t-Test for Correlation Coefficients In...Ch. 9.1 - The t-Test for Correlation Coefficients In...Ch. 9.1 - The t-Test for Correlation Coefficients In...Ch. 9.1 - The t-Test for Correlation Coefficients In...Ch. 9.1 - Interchanging x and y In Exercise 26, let the time...Ch. 9.1 - Generate a new data set. Using your knowledge of...Ch. 9.1 - Describe how to create a data set with a value of...Ch. 9.1 - Describe how to create a data set with a value of...Ch. 9.1 - Try to create a data set with a value of r that is...Ch. 9.2 - Find the equation of the regression line for the...Ch. 9.2 - Use technology to find the equation of the...Ch. 9.2 - The regression equation for the Old Faithful data...Ch. 9.2 - What is a residual? Explain when a residual is...Ch. 9.2 - Two variables have a positive linear correlation....Ch. 9.2 - Explain how to predict y-values using the equation...Ch. 9.2 - For a set of data and a corresponding regression...Ch. 9.2 - In order to predict y-values using the equation of...Ch. 9.2 - Why is it not appropriate to use a regression line...Ch. 9.2 - In Exercises 712, match the description in the...Ch. 9.2 - In Exercises 712, match the description in the...Ch. 9.2 - In Exercises 712, match the description in the...Ch. 9.2 - In Exercises 712, match the description in the...Ch. 9.2 - In Exercises 712, match the description in the...Ch. 9.2 - In Exercises 712, match the description in the...Ch. 9.2 - Graphical Analysis In Exercises 1316, match the...Ch. 9.2 - Graphical Analysis In Exercises 1316, match the...Ch. 9.2 - Graphical Analysis In Exercises 1316, match the...Ch. 9.2 - Graphical Analysis In Exercises 1316, match the...Ch. 9.2 - Finding the Equation of a Regression Line In...Ch. 9.2 - Finding the Equation of a Regression Line In...Ch. 9.2 - Finding the Equation of a Regression Line In...Ch. 9.2 - Finding the Equation of a Regression Line In...Ch. 9.2 - Finding the Equation of a Regression Line In...Ch. 9.2 - Finding the Equation of a Regression Line In...Ch. 9.2 - Finding the Equation of a Regression Line In...Ch. 9.2 - Finding the Equation of a Regression Line In...Ch. 9.2 - Finding the Equation of a Regression Line In...Ch. 9.2 - Finding the Equation of a Regression Line In...Ch. 9.2 - Registered Nurse Salaries In Exercises 2730, use...Ch. 9.2 - Registered Nurse Salaries In Exercises 2730, use...Ch. 9.2 - Registered Nurse Salaries In Exercises 2730, use...Ch. 9.2 - Registered Nurse Salaries In Exercises 2730, use...Ch. 9.2 - Interchanging X and y In Exercises 31 and 32,...Ch. 9.2 - Interchanging X and y In Exercises 31 and 32,...Ch. 9.2 - In Exercises 33 and 34, (a) find the equation of...Ch. 9.2 - In Exercises 33 and 34, (a) find the equation of...Ch. 9.2 - In Exercises 35 and 36, (a) construct a scatter...Ch. 9.2 - Prob. 36ECh. 9.2 - Prob. 37ECh. 9.2 - Prob. 38ECh. 9.2 - Prob. 39ECh. 9.2 - Prob. 40ECh. 9.2 - Prob. 41ECh. 9.2 - Prob. 42ECh. 9.2 - Prob. 43ECh. 9.2 - Prob. 44ECh. 9.2 - Prob. 45ECh. 9.2 - Prob. 46ECh. 9.2 - Prob. 47ECh. 9.2 - Prob. 48ECh. 9.2 - Prob. 1ACh. 9.2 - Prob. 2ACh. 9.2 - Prob. 3ACh. 9.2 - Prob. 4ACh. 9.3 - The correlation coefficient for the Old Faithful...Ch. 9.3 - Prob. 2TYCh. 9.3 - Using the results of Example 2, construct a 95%...Ch. 9.3 - Graphical Analysis In Exercises 13, use the...Ch. 9.3 - Graphical Analysis In Exercises 13, use the...Ch. 9.3 - Graphical Analysis In Exercises 13, use the...Ch. 9.3 - The coefficient of determination r2 is the ratio...Ch. 9.3 - What is the coefficient of determination for two...Ch. 9.3 - Two variables have a bivariate normal...Ch. 9.3 - In Exercises 710, use the value of the correlation...Ch. 9.3 - In Exercises 710, use the value of the correlation...Ch. 9.3 - In Exercises 710, use the value of the correlation...Ch. 9.3 - In Exercises 710, use the value of the correlation...Ch. 9.3 - Finding the Coefficient of Determination and the...Ch. 9.3 - Finding the Coefficient of Determination and the...Ch. 9.3 - Finding the Coefficient of Determination and the...Ch. 9.3 - Finding the Coefficient of Determination and the...Ch. 9.3 - Finding the Coefficient of Determination and the...Ch. 9.3 - Finding the Coefficient of Determination and the...Ch. 9.3 - Finding the Coefficient of Determination and the...Ch. 9.3 - Finding the Coefficient of Determination and the...Ch. 9.3 - Finding the Coefficient of Determination and the...Ch. 9.3 - Finding the Coefficient of Determination and the...Ch. 9.3 - Constructing and Interpreting a Prediction...Ch. 9.3 - Constructing and Interpreting a Prediction...Ch. 9.3 - Constructing and Interpreting a Prediction...Ch. 9.3 - Constructing and Interpreting a Prediction...Ch. 9.3 - STEM Employment and Mean Wage The table shows the...Ch. 9.3 - Constructing and Interpreting a Prediction...Ch. 9.3 - Constructing and Interpreting a Prediction...Ch. 9.3 - Fund Assets The table shows the total assets (in...Ch. 9.3 - New-Vehicle Sales The table shows the numbers of...Ch. 9.3 - New-Vehicle Sales The table shows the numbers of...Ch. 9.3 - Old Vehicles In Exercises 3134, use the figure...Ch. 9.3 - Old Vehicles In Exercises 3134, use the figure...Ch. 9.3 - Old Vehicles In Exercises 3134, use the figure...Ch. 9.3 - Old Vehicles In Exercises 3134, use the figure...Ch. 9.3 - Prob. 35ECh. 9.3 - Prob. 36ECh. 9.3 - Prob. 37ECh. 9.3 - In Exercises 37 and 38, construct the indicated...Ch. 9.4 - A statistics professor wants to determine how...Ch. 9.4 - Use the regression equation found in Try It...Ch. 9.4 - Predicting y-Values In Exercises 14, use the...Ch. 9.4 - Predicting y-Values In Exercises 14, use the...Ch. 9.4 - Prob. 3ECh. 9.4 - Predicting y-Values In Exercises 14, use the...Ch. 9.4 - Finding a Multiple Regression Equation In...Ch. 9.4 - Finding a Multiple Regression Equation In...Ch. 9.4 - In Exercises 7 and 8, calculate r2adi and...Ch. 9.4 - In Exercises 7 and 8, calculate r2adi and...Ch. 9 - In Exercises 14, (a) display the data in a scatter...Ch. 9 - In Exercises 14, (a) display the data in a scatter...Ch. 9 - In Exercises 14, (a) display the data in a scatter...Ch. 9 - In Exercises 14, (a) display the data in a scatter...Ch. 9 - Prob. 9.1.5RECh. 9 - Prob. 9.1.6RECh. 9 - Prob. 9.1.7RECh. 9 - Prob. 9.1.8RECh. 9 - In Exercises 912, find the equation of the...Ch. 9 - Prob. 9.2.10RECh. 9 - In Exercises 912, find the equation of the...Ch. 9 - Prob. 9.2.12RECh. 9 - In Exercises 1316, use the value of the...Ch. 9 - Prob. 9.3.14RECh. 9 - Prob. 9.3.15RECh. 9 - Prob. 9.3.16RECh. 9 - Prob. 9.3.17RECh. 9 - Prob. 9.3.18RECh. 9 - Prob. 9.3.19RECh. 9 - Prob. 9.3.20RECh. 9 - Prob. 9.3.21RECh. 9 - In Exercises 1924, construct the indicated...Ch. 9 - Prob. 9.3.23RECh. 9 - Prob. 9.3.24RECh. 9 - Prob. 9.4.25RECh. 9 - Prob. 9.4.26RECh. 9 - Prob. 9.4.27RECh. 9 - Prob. 9.4.28RECh. 9 - Prob. 1CQCh. 9 - For Exercises 18, use the data in the table, which...Ch. 9 - Prob. 3CQCh. 9 - Prob. 4CQCh. 9 - Prob. 5CQCh. 9 - Prob. 6CQCh. 9 - Prob. 7CQCh. 9 - For Exercises 18, use the data in the table, which...Ch. 9 - Prob. 9CQCh. 9 - Net Sales The equation used to predict the net...Ch. 9 - For Exercises 29, use the data in the table, which...Ch. 9 - For Exercises 29, use the data in the table, which...Ch. 9 - For Exercises 29, use the data in the table, which...Ch. 9 - For Exercises 29, use the data in the table, which...Ch. 9 - For Exercises 29, use the data in the table, which...Ch. 9 - For Exercises 29, use the data in the table, which...Ch. 9 - For Exercises 29, use the data in the table, which...Ch. 9 - For Exercises 29, use the data in the table, which...Ch. 9 - Analyzing the Data (a) The data in the table show...Ch. 9 - Making Predictions Construct a 95% prediction...Ch. 9 - Prob. 1TCh. 9 - Prob. 2TCh. 9 - Prob. 3TCh. 9 - Prob. 4TCh. 9 - Prob. 5TCh. 9 - Use technology to find the multiple regression...Ch. 9 - Prob. 7T
Knowledge Booster


Learn more about
Need a deep-dive on the concept behind this application? Look no further. Learn more about this topic, statistics and related others by exploring similar questions and additional content below.Similar questions
- Negate the following compound statement using De Morgans's laws.arrow_forwardQuestion 6: Negate the following compound statements, using De Morgan's laws. A) If Alberta was under water entirely then there should be no fossil of mammals.arrow_forwardNegate the following compound statement using De Morgans's laws.arrow_forward
- Characterize (with proof) all connected graphs that contain no even cycles in terms oftheir blocks.arrow_forwardLet G be a connected graph that does not have P4 or C3 as an induced subgraph (i.e.,G is P4, C3 free). Prove that G is a complete bipartite grapharrow_forwardProve sufficiency of the condition for a graph to be bipartite that is, prove that if G hasno odd cycles then G is bipartite as follows:Assume that the statement is false and that G is an edge minimal counterexample. That is, Gsatisfies the conditions and is not bipartite but G − e is bipartite for any edge e. (Note thatthis is essentially induction, just using different terminology.) What does minimality say aboutconnectivity of G? Can G − e be disconnected? Explain why if there is an edge between twovertices in the same part of a bipartition of G − e then there is an odd cyclearrow_forward
- Let G be a connected graph that does not have P4 or C4 as an induced subgraph (i.e.,G is P4, C4 free). Prove that G has a vertex adjacent to all othersarrow_forwardWe consider a one-period market with the following properties: the current stock priceis S0 = 4. At time T = 1 year, the stock has either moved up to S1 = 8 (with probability0.7) or down towards S1 = 2 (with probability 0.3). We consider a call option on thisstock with maturity T = 1 and strike price K = 5. The interest rate on the money marketis 25% yearly.(a) Find the replicating portfolio (φ, ψ) corresponding to this call option.(b) Find the risk-neutral (no-arbitrage) price of this call option.(c) We now consider a put option with maturity T = 1 and strike price K = 3 onthe same market. Find the risk-neutral price of this put option. Reminder: A putoption gives you the right to sell the stock for the strike price K.1(d) An investor with initial capital X0 = 0 wants to invest on this market. He buysα shares of the stock (or sells them if α is negative) and buys β call options (orsells them is β is negative). He invests the cash balance on the money market (orborrows if the amount is…arrow_forwardDetermine if the two statements are equivalent using a truth tablearrow_forward
- Question 4: Determine if pair of statements A and B are equivalent or not, using truth table. A. (~qp)^~q в. р л~9arrow_forwardDetermine if the two statements are equalivalent using a truth tablearrow_forwardQuestion 3: p and q represent the following simple statements. p: Calgary is the capital of Alberta. A) Determine the value of each simple statement p and q. B) Then, without truth table, determine the va q: Alberta is a province of Canada. for each following compound statement below. pvq р^~q ~рл~q ~q→ p ~P~q Pq b~ (d~ ← b~) d~ (b~ v d) 0 4arrow_forward
arrow_back_ios
SEE MORE QUESTIONS
arrow_forward_ios
Recommended textbooks for you
 Big Ideas Math A Bridge To Success Algebra 1: Stu...AlgebraISBN:9781680331141Author:HOUGHTON MIFFLIN HARCOURTPublisher:Houghton Mifflin Harcourt
 Functions and Change: A Modeling Approach to Coll...AlgebraISBN:9781337111348Author:Bruce Crauder, Benny Evans, Alan NoellPublisher:Cengage Learning
 Glencoe Algebra 1, Student Edition, 9780079039897...AlgebraISBN:9780079039897Author:CarterPublisher:McGraw Hill
Big Ideas Math A Bridge To Success Algebra 1: Stu...
Algebra
ISBN:9781680331141
Author:HOUGHTON MIFFLIN HARCOURT
Publisher:Houghton Mifflin Harcourt
Functions and Change: A Modeling Approach to Coll...
Algebra
ISBN:9781337111348
Author:Bruce Crauder, Benny Evans, Alan Noell
Publisher:Cengage Learning
Glencoe Algebra 1, Student Edition, 9780079039897...
Algebra
ISBN:9780079039897
Author:Carter
Publisher:McGraw Hill
Correlation Vs Regression: Difference Between them with definition & Comparison Chart; Author: Key Differences;https://www.youtube.com/watch?v=Ou2QGSJVd0U;License: Standard YouTube License, CC-BY
Correlation and Regression: Concepts with Illustrative examples; Author: LEARN & APPLY : Lean and Six Sigma;https://www.youtube.com/watch?v=xTpHD5WLuoA;License: Standard YouTube License, CC-BY