
Pearson eText for Elementary Statistics: Picturing the World -- Instant Access (Pearson+)
7th Edition
ISBN: 9780137504329
Author: Ron Larson, Betsy Farber
Publisher: PEARSON+
expand_more
expand_more
format_list_bulleted
Concept explainers
Videos
Textbook Question
Chapter 9.3, Problem 22E
Constructing and Interpreting a Prediction Interval In Exercises 21–30, construct the indicated prediction interval and interpret the results.
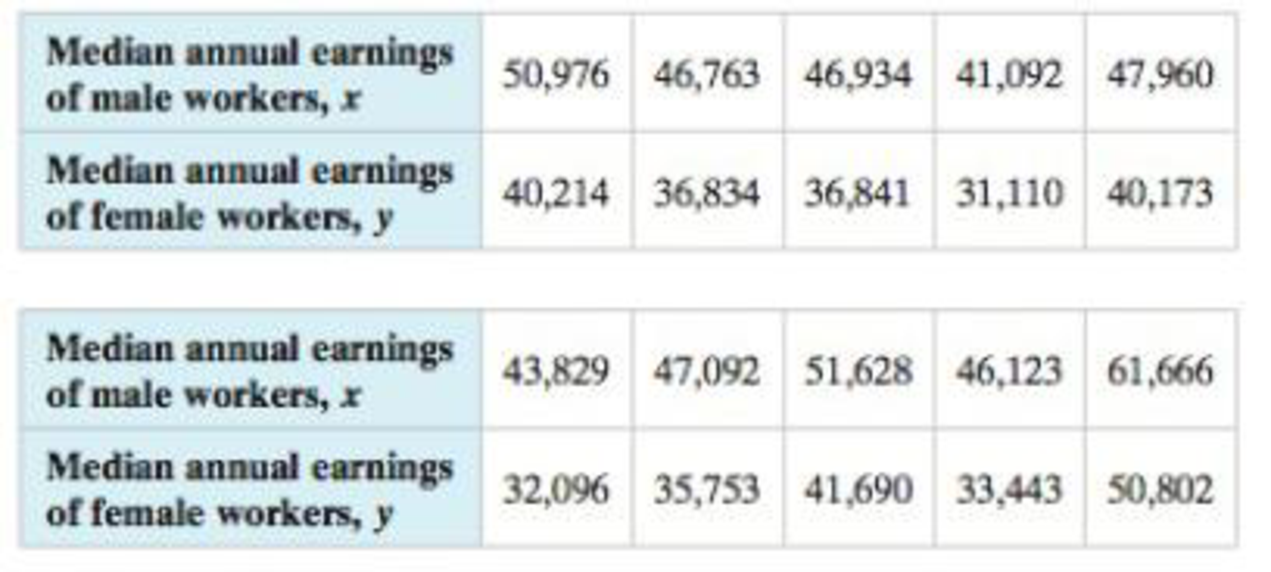
22. Earnings of Women Construct a 95% prediction interval for the
12. Earnings of Men and Women The table shows the median annual earnings (in dollars) of male and female workers from 10 states in a recent year. The equation of the regression line is ŷ = 1.005x – 10,770.313. (Source. U.S. Census Bureau)
Expert Solution & Answer
Want to see the full answer?
Check out a sample textbook solution
Students have asked these similar questions
please find the answers for the yellows boxes using the information and the picture below
A marketing agency wants to determine whether different advertising platforms generate significantly different levels of customer engagement. The agency measures the average number of daily clicks on ads for three platforms: Social Media, Search Engines, and Email Campaigns. The agency collects data on daily clicks for each platform over a 10-day period and wants to test whether there is a statistically significant difference in the mean number of daily clicks among these platforms. Conduct ANOVA test.
You can provide your answer by inserting a text box and the answer must include: also please provide a step by on getting the answers in excel
Null hypothesis,
Alternative hypothesis,
Show answer (output table/summary table), and
Conclusion based on the P value.
A company found that the daily sales revenue of its flagship product follows a normal distribution with a mean of $4500 and a standard deviation of $450. The company defines a "high-sales day" that is, any day with sales exceeding $4800. please provide a step by step on how to get the answers
Q: What percentage of days can the company expect to have "high-sales days" or sales greater than $4800?
Q: What is the sales revenue threshold for the bottom 10% of days? (please note that 10% refers to the probability/area under bell curve towards the lower tail of bell curve)
Provide answers in the yellow cells
Chapter 9 Solutions
Pearson eText for Elementary Statistics: Picturing the World -- Instant Access (Pearson+)
Ch. 9.1 - A director of alumni affairs at a small college...Ch. 9.1 - A researcher conducts a study to determine whether...Ch. 9.1 - Consider the data on page 469 on the salaries and...Ch. 9.1 - Calculate the correlation coefficient for the...Ch. 9.1 - Use technology to calculate the correlation...Ch. 9.1 - In Try It Yourself 4, you calculated the...Ch. 9.1 - In Try It Yourself 5, you calculated the...Ch. 9.1 - Two variables have a positive linear correlation....Ch. 9.1 - Describe the range of values for the correlation...Ch. 9.1 - What does the sample correlation coefficient r...
Ch. 9.1 - Give examples of two variables that have perfect...Ch. 9.1 - Explain how to determine whether a sample...Ch. 9.1 - Discuss the difference between r and p.Ch. 9.1 - What are the null and alternate hypotheses for a...Ch. 9.1 - In your own words, what does it mean to say...Ch. 9.1 - Graphical Analysis In Exercises 912, determine...Ch. 9.1 - Graphical Analysis In Exercises 912, determine...Ch. 9.1 - Graphical Analysis In Exercises 912, determine...Ch. 9.1 - Graphical Analysis In Exercises 912, determine...Ch. 9.1 - In Exercises 13 and 14, identify the explanatory...Ch. 9.1 - In Exercises 13 and 14, identify the explanatory...Ch. 9.1 - Graphical Analysis In Exercises 1518, the scatter...Ch. 9.1 - Graphical Analysis In Exercises 1518, the scatter...Ch. 9.1 - Graphical Analysis In Exercises 1518, the scatter...Ch. 9.1 - Graphical Analysis In Exercises 1518, the scatter...Ch. 9.1 - In Exercises 1922, two variables are given that...Ch. 9.1 - In Exercises 1922, two variables are given that...Ch. 9.1 - In Exercises 1922, two variables are given that...Ch. 9.1 - In Exercises 1922, two variables are given that...Ch. 9.1 - Constructing a Scatter Plot and Determining...Ch. 9.1 - Constructing a Scatter Plot and Determining...Ch. 9.1 - Constructing a Scatter Plot and Determining...Ch. 9.1 - Constructing a Scatter Plot and Determining...Ch. 9.1 - Constructing a Scatter Plot and Determining...Ch. 9.1 - Constructing a Scatter Plot and Determining...Ch. 9.1 - In Exercise 23, add data for a child who is 6...Ch. 9.1 - In Exercise 24, remove the data for the girl who...Ch. 9.1 - In Exercise 25, remove the data for the...Ch. 9.1 - In Exercise 26, add data for an international...Ch. 9.1 - The t-Test for Correlation Coefficients In...Ch. 9.1 - The t-Test for Correlation Coefficients In...Ch. 9.1 - The t-Test for Correlation Coefficients In...Ch. 9.1 - The t-Test for Correlation Coefficients In...Ch. 9.1 - Interchanging x and y In Exercise 26, let the time...Ch. 9.1 - Generate a new data set. Using your knowledge of...Ch. 9.1 - Describe how to create a data set with a value of...Ch. 9.1 - Describe how to create a data set with a value of...Ch. 9.1 - Try to create a data set with a value of r that is...Ch. 9.2 - Find the equation of the regression line for the...Ch. 9.2 - Use technology to find the equation of the...Ch. 9.2 - The regression equation for the Old Faithful data...Ch. 9.2 - What is a residual? Explain when a residual is...Ch. 9.2 - Two variables have a positive linear correlation....Ch. 9.2 - Explain how to predict y-values using the equation...Ch. 9.2 - For a set of data and a corresponding regression...Ch. 9.2 - In order to predict y-values using the equation of...Ch. 9.2 - Why is it not appropriate to use a regression line...Ch. 9.2 - In Exercises 712, match the description in the...Ch. 9.2 - In Exercises 712, match the description in the...Ch. 9.2 - In Exercises 712, match the description in the...Ch. 9.2 - In Exercises 712, match the description in the...Ch. 9.2 - In Exercises 712, match the description in the...Ch. 9.2 - In Exercises 712, match the description in the...Ch. 9.2 - Graphical Analysis In Exercises 1316, match the...Ch. 9.2 - Graphical Analysis In Exercises 1316, match the...Ch. 9.2 - Graphical Analysis In Exercises 1316, match the...Ch. 9.2 - Graphical Analysis In Exercises 1316, match the...Ch. 9.2 - Finding the Equation of a Regression Line In...Ch. 9.2 - Finding the Equation of a Regression Line In...Ch. 9.2 - Finding the Equation of a Regression Line In...Ch. 9.2 - Finding the Equation of a Regression Line In...Ch. 9.2 - Finding the Equation of a Regression Line In...Ch. 9.2 - Finding the Equation of a Regression Line In...Ch. 9.2 - Finding the Equation of a Regression Line In...Ch. 9.2 - Finding the Equation of a Regression Line In...Ch. 9.2 - Finding the Equation of a Regression Line In...Ch. 9.2 - Finding the Equation of a Regression Line In...Ch. 9.2 - Registered Nurse Salaries In Exercises 2730, use...Ch. 9.2 - Registered Nurse Salaries In Exercises 2730, use...Ch. 9.2 - Registered Nurse Salaries In Exercises 2730, use...Ch. 9.2 - Registered Nurse Salaries In Exercises 2730, use...Ch. 9.2 - Interchanging X and y In Exercises 31 and 32,...Ch. 9.2 - Interchanging X and y In Exercises 31 and 32,...Ch. 9.2 - In Exercises 33 and 34, (a) find the equation of...Ch. 9.2 - In Exercises 33 and 34, (a) find the equation of...Ch. 9.2 - In Exercises 35 and 36, (a) construct a scatter...Ch. 9.2 - Prob. 36ECh. 9.2 - Prob. 37ECh. 9.2 - Prob. 38ECh. 9.2 - Prob. 39ECh. 9.2 - Prob. 40ECh. 9.2 - Prob. 41ECh. 9.2 - Prob. 42ECh. 9.2 - Prob. 43ECh. 9.2 - Prob. 44ECh. 9.2 - Prob. 45ECh. 9.2 - Prob. 46ECh. 9.2 - Prob. 47ECh. 9.2 - Prob. 48ECh. 9.2 - Prob. 1ACh. 9.2 - Prob. 2ACh. 9.2 - Prob. 3ACh. 9.2 - Prob. 4ACh. 9.3 - The correlation coefficient for the Old Faithful...Ch. 9.3 - Prob. 2TYCh. 9.3 - Using the results of Example 2, construct a 95%...Ch. 9.3 - Graphical Analysis In Exercises 13, use the...Ch. 9.3 - Graphical Analysis In Exercises 13, use the...Ch. 9.3 - Graphical Analysis In Exercises 13, use the...Ch. 9.3 - The coefficient of determination r2 is the ratio...Ch. 9.3 - What is the coefficient of determination for two...Ch. 9.3 - Two variables have a bivariate normal...Ch. 9.3 - In Exercises 710, use the value of the correlation...Ch. 9.3 - In Exercises 710, use the value of the correlation...Ch. 9.3 - In Exercises 710, use the value of the correlation...Ch. 9.3 - In Exercises 710, use the value of the correlation...Ch. 9.3 - Finding the Coefficient of Determination and the...Ch. 9.3 - Finding the Coefficient of Determination and the...Ch. 9.3 - Finding the Coefficient of Determination and the...Ch. 9.3 - Finding the Coefficient of Determination and the...Ch. 9.3 - Finding the Coefficient of Determination and the...Ch. 9.3 - Finding the Coefficient of Determination and the...Ch. 9.3 - Finding the Coefficient of Determination and the...Ch. 9.3 - Finding the Coefficient of Determination and the...Ch. 9.3 - Finding the Coefficient of Determination and the...Ch. 9.3 - Finding the Coefficient of Determination and the...Ch. 9.3 - Constructing and Interpreting a Prediction...Ch. 9.3 - Constructing and Interpreting a Prediction...Ch. 9.3 - Constructing and Interpreting a Prediction...Ch. 9.3 - Constructing and Interpreting a Prediction...Ch. 9.3 - STEM Employment and Mean Wage The table shows the...Ch. 9.3 - Constructing and Interpreting a Prediction...Ch. 9.3 - Constructing and Interpreting a Prediction...Ch. 9.3 - Fund Assets The table shows the total assets (in...Ch. 9.3 - New-Vehicle Sales The table shows the numbers of...Ch. 9.3 - New-Vehicle Sales The table shows the numbers of...Ch. 9.3 - Old Vehicles In Exercises 3134, use the figure...Ch. 9.3 - Old Vehicles In Exercises 3134, use the figure...Ch. 9.3 - Old Vehicles In Exercises 3134, use the figure...Ch. 9.3 - Old Vehicles In Exercises 3134, use the figure...Ch. 9.3 - Prob. 35ECh. 9.3 - Prob. 36ECh. 9.3 - Prob. 37ECh. 9.3 - In Exercises 37 and 38, construct the indicated...Ch. 9.4 - A statistics professor wants to determine how...Ch. 9.4 - Use the regression equation found in Try It...Ch. 9.4 - Predicting y-Values In Exercises 14, use the...Ch. 9.4 - Predicting y-Values In Exercises 14, use the...Ch. 9.4 - Prob. 3ECh. 9.4 - Predicting y-Values In Exercises 14, use the...Ch. 9.4 - Finding a Multiple Regression Equation In...Ch. 9.4 - Finding a Multiple Regression Equation In...Ch. 9.4 - In Exercises 7 and 8, calculate r2adi and...Ch. 9.4 - In Exercises 7 and 8, calculate r2adi and...Ch. 9 - In Exercises 14, (a) display the data in a scatter...Ch. 9 - In Exercises 14, (a) display the data in a scatter...Ch. 9 - In Exercises 14, (a) display the data in a scatter...Ch. 9 - In Exercises 14, (a) display the data in a scatter...Ch. 9 - Prob. 9.1.5RECh. 9 - Prob. 9.1.6RECh. 9 - Prob. 9.1.7RECh. 9 - Prob. 9.1.8RECh. 9 - In Exercises 912, find the equation of the...Ch. 9 - Prob. 9.2.10RECh. 9 - In Exercises 912, find the equation of the...Ch. 9 - Prob. 9.2.12RECh. 9 - In Exercises 1316, use the value of the...Ch. 9 - Prob. 9.3.14RECh. 9 - Prob. 9.3.15RECh. 9 - Prob. 9.3.16RECh. 9 - Prob. 9.3.17RECh. 9 - Prob. 9.3.18RECh. 9 - Prob. 9.3.19RECh. 9 - Prob. 9.3.20RECh. 9 - Prob. 9.3.21RECh. 9 - In Exercises 1924, construct the indicated...Ch. 9 - Prob. 9.3.23RECh. 9 - Prob. 9.3.24RECh. 9 - Prob. 9.4.25RECh. 9 - Prob. 9.4.26RECh. 9 - Prob. 9.4.27RECh. 9 - Prob. 9.4.28RECh. 9 - Prob. 1CQCh. 9 - For Exercises 18, use the data in the table, which...Ch. 9 - Prob. 3CQCh. 9 - Prob. 4CQCh. 9 - Prob. 5CQCh. 9 - Prob. 6CQCh. 9 - Prob. 7CQCh. 9 - For Exercises 18, use the data in the table, which...Ch. 9 - Prob. 9CQCh. 9 - Net Sales The equation used to predict the net...Ch. 9 - For Exercises 29, use the data in the table, which...Ch. 9 - For Exercises 29, use the data in the table, which...Ch. 9 - For Exercises 29, use the data in the table, which...Ch. 9 - For Exercises 29, use the data in the table, which...Ch. 9 - For Exercises 29, use the data in the table, which...Ch. 9 - For Exercises 29, use the data in the table, which...Ch. 9 - For Exercises 29, use the data in the table, which...Ch. 9 - For Exercises 29, use the data in the table, which...Ch. 9 - Analyzing the Data (a) The data in the table show...Ch. 9 - Making Predictions Construct a 95% prediction...Ch. 9 - Prob. 1TCh. 9 - Prob. 2TCh. 9 - Prob. 3TCh. 9 - Prob. 4TCh. 9 - Prob. 5TCh. 9 - Use technology to find the multiple regression...Ch. 9 - Prob. 7T
Knowledge Booster


Learn more about
Need a deep-dive on the concept behind this application? Look no further. Learn more about this topic, statistics and related others by exploring similar questions and additional content below.Similar questions
- Business Discussarrow_forwardThe following data represent total ventilation measured in liters of air per minute per square meter of body area for two independent (and randomly chosen) samples. Analyze these data using the appropriate non-parametric hypothesis testarrow_forwardeach column represents before & after measurements on the same individual. Analyze with the appropriate non-parametric hypothesis test for a paired design.arrow_forward
- Should you be confident in applying your regression equation to estimate the heart rate of a python at 35°C? Why or why not?arrow_forwardGiven your fitted regression line, what would be the residual for snake #5 (10 C)?arrow_forwardCalculate the 95% confidence interval around your estimate of r using Fisher’s z-transformation. In your final answer, make sure to back-transform to the original units.arrow_forward
arrow_back_ios
SEE MORE QUESTIONS
arrow_forward_ios
Recommended textbooks for you
 Functions and Change: A Modeling Approach to Coll...AlgebraISBN:9781337111348Author:Bruce Crauder, Benny Evans, Alan NoellPublisher:Cengage Learning
 Big Ideas Math A Bridge To Success Algebra 1: Stu...AlgebraISBN:9781680331141Author:HOUGHTON MIFFLIN HARCOURTPublisher:Houghton Mifflin Harcourt
Functions and Change: A Modeling Approach to Coll...
Algebra
ISBN:9781337111348
Author:Bruce Crauder, Benny Evans, Alan Noell
Publisher:Cengage Learning
Big Ideas Math A Bridge To Success Algebra 1: Stu...
Algebra
ISBN:9781680331141
Author:HOUGHTON MIFFLIN HARCOURT
Publisher:Houghton Mifflin Harcourt
Correlation Vs Regression: Difference Between them with definition & Comparison Chart; Author: Key Differences;https://www.youtube.com/watch?v=Ou2QGSJVd0U;License: Standard YouTube License, CC-BY
Correlation and Regression: Concepts with Illustrative examples; Author: LEARN & APPLY : Lean and Six Sigma;https://www.youtube.com/watch?v=xTpHD5WLuoA;License: Standard YouTube License, CC-BY