EBK STARTING OUT WITH VISUAL C#
5th Edition
ISBN: 9780135204818
Author: GADDIS
Publisher: VST
expand_more
expand_more
format_list_bulleted
Question
Chapter 9, Problem 9PP
Program Plan Intro
Form design:
- Open Microsoft Visual Studio 2010.
- Select C# and click Windows Forms Application.
- Name the project as FrequencyCounter.
- Store the file in desire location.
- The created project is now display with a form in the name of Form1.
- Select the Form1 and add the necessary components.
- In property window, change the Form name and add changes for Form elements properties.
- Click the File menu->Save All.
View of the form design in the IDE:
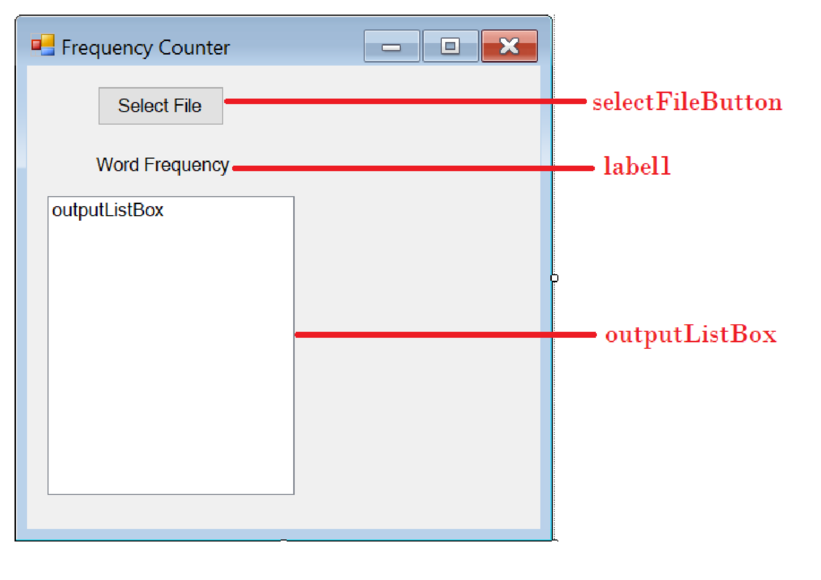
The form control properties in the properties window are as follows:
| Object | Property | Setting |
| Form1 | Text | Frequency Counter |
| selectFileButton | Text | Select File |
| label1 | Text | Word Frequency |
| outputListBox | Text | (Empty) |
- Add a button control “selectFileButton” to select the file.
- Add a label control to display “Word Frequency”.
- Add a list box control to display the output of word frequency from the given input file.
Expert Solution & Answer
Want to see the full answer?
Check out a sample textbook solution
Students have asked these similar questions
Question 1 Generate a random sample of standard lognormal data (rlnorm()) for sample size n = 100. Construct histogram estimates of density for this sample using Sturges’ Rule, Scott’s Normal Reference Rule, and the FD Rule. Question 2 Construct a frequency polygon density estimate for the sample in Question 1, using bin width determined by Sturges’ Rule.
Generate a random sample of standard lognormal data (rlnorm()) for sample size n = 100. Construct histogram estimates of density for this sample using Sturges’ Rule, Scott’s Normal Reference Rule, and the FD Rule.
Can I get help with this case please, thank you
Chapter 9 Solutions
EBK STARTING OUT WITH VISUAL C#
Ch. 9.2 - Prob. 9.1CPCh. 9.2 - Prob. 9.2CPCh. 9.2 - Prob. 9.3CPCh. 9.2 - Prob. 9.4CPCh. 9.2 - Prob. 9.5CPCh. 9.2 - Prob. 9.6CPCh. 9.2 - Prob. 9.7CPCh. 9.2 - Prob. 9.8CPCh. 9.3 - Prob. 9.9CPCh. 9.3 - Prob. 9.10CP
Ch. 9.3 - Prob. 9.11CPCh. 9.3 - Prob. 9.12CPCh. 9.3 - Prob. 9.13CPCh. 9.3 - Prob. 9.14CPCh. 9.3 - Prob. 9.15CPCh. 9.3 - Prob. 9.16CPCh. 9.4 - Prob. 9.17CPCh. 9.4 - Prob. 9.18CPCh. 9.4 - Prob. 9.19CPCh. 9.5 - Prob. 9.20CPCh. 9.5 - Prob. 9.21CPCh. 9.5 - Prob. 9.22CPCh. 9.5 - Prob. 9.23CPCh. 9.5 - Prob. 9.24CPCh. 9 - Prob. 1MCCh. 9 - Prob. 2MCCh. 9 - Prob. 3MCCh. 9 - Prob. 4MCCh. 9 - Prob. 5MCCh. 9 - Prob. 6MCCh. 9 - Prob. 7MCCh. 9 - Prob. 8MCCh. 9 - Prob. 9MCCh. 9 - Prob. 10MCCh. 9 - Prob. 11MCCh. 9 - Prob. 12MCCh. 9 - Prob. 13MCCh. 9 - Prob. 14MCCh. 9 - Prob. 1TFCh. 9 - Prob. 2TFCh. 9 - Prob. 3TFCh. 9 - Prob. 4TFCh. 9 - Prob. 5TFCh. 9 - Prob. 6TFCh. 9 - Prob. 7TFCh. 9 - Prob. 8TFCh. 9 - Prob. 9TFCh. 9 - Prob. 10TFCh. 9 - Prob. 11TFCh. 9 - Prob. 12TFCh. 9 - Prob. 13TFCh. 9 - Prob. 1SACh. 9 - Prob. 2SACh. 9 - Prob. 3SACh. 9 - Prob. 4SACh. 9 - Prob. 5SACh. 9 - Prob. 6SACh. 9 - Prob. 7SACh. 9 - Prob. 1AWCh. 9 - Prob. 2AWCh. 9 - Prob. 3AWCh. 9 - Prob. 4AWCh. 9 - Prob. 5AWCh. 9 - Prob. 6AWCh. 9 - Prob. 7AWCh. 9 - Prob. 8AWCh. 9 - Prob. 9AWCh. 9 - WEATHER DATA In the student sample progr4n files...Ch. 9 - Prob. 2PPCh. 9 - Prob. 3PPCh. 9 - Prob. 4PPCh. 9 - Prob. 5PPCh. 9 - COURSE INFORMATION Write a program that creates a...Ch. 9 - Prob. 7PPCh. 9 - Prob. 8PPCh. 9 - Prob. 9PPCh. 9 - Prob. 10PPCh. 9 - Prob. 11PPCh. 9 - Prob. 12PP
Knowledge Booster

Similar questions
- I need help to solve the following, thank youarrow_forwardreminder it an exercice not a grading work GETTING STARTED Open the file SC_EX19_EOM2-1_FirstLastNamexlsx, available for download from the SAM website. Save the file as SC_EX19_EOM2-1_FirstLastNamexlsx by changing the “1” to a “2”. If you do not see the .xlsx file extension in the Save As dialog box, do not type it. The program will add the file extension for you automatically. With the file SC_EX19_EOM2-1_FirstLastNamexlsx still open, ensure that your first and last name is displayed in cell B6 of the Documentation sheet. If cell B6 does not display your name, delete the file and download a new copy from the SAM website. Brad Kauffman is the senior director of projects for Rivera Engineering in Miami, Florida. The company performs engineering projects for public utilities and energy companies. Brad has started to create an Excel workbook to track estimated and actual hours and billing amounts for each project. He asks you to format the workbook to make the…arrow_forwardNeed help completing this algorithm here in coding! 2arrow_forward
- In the diagram, there is a green arrow pointing from Input C (complete data) to Transformer Encoder S_B, which I don’t understand. The teacher model is trained on full data, but S_B should instead receive missing data—this arrow should not point there. Please verify and recreate the diagram to fix this issue. Additionally, the newly created diagram should meet the same clarity standards as the second diagram (Proposed MSCATN). Finally provide the output image of the diagram in image format .arrow_forwardPlease provide me with the output image of both of them . below are the diagrams code make sure to update the code and mentionned clearly each section also the digram should be clearly describe like in the attached image. please do not provide the same answer like in other question . I repost this question because it does not satisfy the requirment I need in terms of clarifty the output of both code are not very well details I have two diagram : first diagram code graph LR subgraph Teacher Model (Pretrained) Input_Teacher[Input C (Complete Data)] --> Teacher_Encoder[Transformer Encoder T] Teacher_Encoder --> Teacher_Prediction[Teacher Prediction y_T] Teacher_Encoder --> Teacher_Features[Internal Features F_T] end subgraph Student_A_Model[Student Model A (Handles Missing Values)] Input_Student_A[Input M (Data with Missing Values)] --> Student_A_Encoder[Transformer Encoder E_A] Student_A_Encoder --> Student_A_Prediction[Student A Prediction y_A] Student_A_Encoder…arrow_forwardWhy I need ?arrow_forward
arrow_back_ios
SEE MORE QUESTIONS
arrow_forward_ios
Recommended textbooks for you
 Database System ConceptsComputer ScienceISBN:9780078022159Author:Abraham Silberschatz Professor, Henry F. Korth, S. SudarshanPublisher:McGraw-Hill Education
 Starting Out with Python (4th Edition)Computer ScienceISBN:9780134444321Author:Tony GaddisPublisher:PEARSON
 Digital Fundamentals (11th Edition)Computer ScienceISBN:9780132737968Author:Thomas L. FloydPublisher:PEARSON
 C How to Program (8th Edition)Computer ScienceISBN:9780133976892Author:Paul J. Deitel, Harvey DeitelPublisher:PEARSON
 Database Systems: Design, Implementation, & Manag...Computer ScienceISBN:9781337627900Author:Carlos Coronel, Steven MorrisPublisher:Cengage Learning
 Programmable Logic ControllersComputer ScienceISBN:9780073373843Author:Frank D. PetruzellaPublisher:McGraw-Hill Education
Database System Concepts
Computer Science
ISBN:9780078022159
Author:Abraham Silberschatz Professor, Henry F. Korth, S. Sudarshan
Publisher:McGraw-Hill Education
Starting Out with Python (4th Edition)
Computer Science
ISBN:9780134444321
Author:Tony Gaddis
Publisher:PEARSON
Digital Fundamentals (11th Edition)
Computer Science
ISBN:9780132737968
Author:Thomas L. Floyd
Publisher:PEARSON
C How to Program (8th Edition)
Computer Science
ISBN:9780133976892
Author:Paul J. Deitel, Harvey Deitel
Publisher:PEARSON
Database Systems: Design, Implementation, & Manag...
Computer Science
ISBN:9781337627900
Author:Carlos Coronel, Steven Morris
Publisher:Cengage Learning
Programmable Logic Controllers
Computer Science
ISBN:9780073373843
Author:Frank D. Petruzella
Publisher:McGraw-Hill Education