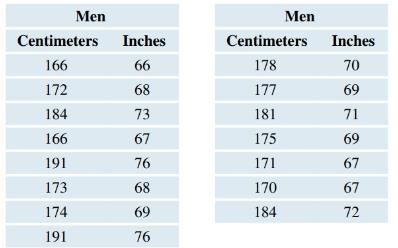
Self-Reported Heights of Men (Example 18) A random sample of students at Oxnard College reported what they believed to be their heights in inches. Then the students measured each others’ heights in centimeters, without shoes. The data shown are for the men. Assume that the conditions for t -tests hold. a. Convert heights in inches to centimeters by multiplying inches by 2.54 . Find a 95 % confidence interval for the mean difference as measured in centimeters. Does it capture 0? What does that show? b. Perform a t -test to test the hypothesis that the means are not the same. Use a significance level of 0.05 , and show all four steps.
Self-Reported Heights of Men (Example 18) A random sample of students at Oxnard College reported what they believed to be their heights in inches. Then the students measured each others’ heights in centimeters, without shoes. The data shown are for the men. Assume that the conditions for t -tests hold. a. Convert heights in inches to centimeters by multiplying inches by 2.54 . Find a 95 % confidence interval for the mean difference as measured in centimeters. Does it capture 0? What does that show? b. Perform a t -test to test the hypothesis that the means are not the same. Use a significance level of 0.05 , and show all four steps.
Solution Summary: The author explains how to obtain the 95% confidence interval for mean differences using the MINITAB software.
Self-Reported Heights of Men (Example 18) A random sample of students at Oxnard College reported what they believed to be their heights in inches. Then the students measured each others’ heights in centimeters, without shoes. The data shown are for the men. Assume that the conditions for
t
-tests
hold.
a. Convert heights in inches to centimeters by multiplying inches by
2.54
. Find a
95
%
confidence interval for the mean difference as measured in centimeters. Does it capture 0? What does that show?
b. Perform a
t
-test
to test the hypothesis that the means are not the same. Use a significance level of
0.05
, and show all four steps.
Definition Definition Measure of central tendency that is the average of a given data set. The mean value is evaluated as the quotient of the sum of all observations by the sample size. The mean, in contrast to a median, is affected by extreme values. Very large or very small values can distract the mean from the center of the data. Arithmetic mean: The most common type of mean is the arithmetic mean. It is evaluated using the formula: μ = 1 N ∑ i = 1 N x i Other types of means are the geometric mean, logarithmic mean, and harmonic mean. Geometric mean: The nth root of the product of n observations from a data set is defined as the geometric mean of the set: G = x 1 x 2 ... x n n Logarithmic mean: The difference of the natural logarithms of the two numbers, divided by the difference between the numbers is the logarithmic mean of the two numbers. The logarithmic mean is used particularly in heat transfer and mass transfer. ln x 2 − ln x 1 x 2 − x 1 Harmonic mean: The inverse of the arithmetic mean of the inverses of all the numbers in a data set is the harmonic mean of the data. 1 1 x 1 + 1 x 2 + ...
The following data represent total ventilation measured in liters of air per minute per square meter of body area for two independent (and randomly chosen) samples.
Analyze these data using the appropriate non-parametric hypothesis test
each column represents before & after measurements on the same individual. Analyze with the appropriate non-parametric hypothesis test for a paired design.
Probability And Statistical Inference (10th Edition)
Knowledge Booster
Learn more about
Need a deep-dive on the concept behind this application? Look no further. Learn more about this topic, statistics and related others by exploring similar questions and additional content below.


 Glencoe Algebra 1, Student Edition, 9780079039897...AlgebraISBN:9780079039897Author:CarterPublisher:McGraw Hill