Ales vs. IPAs Data were collected on calorie content in ales and IPAs and is summarized in the following table. (Source: efficientdrinker.com) a. Does the sample data provide evidence that there is a difference in calorie content for ales and IPAs? Assume the conditions for using a t -test are satisfied. Use a significance level of 0.05 for the hypothesis test. b. If the test had been to determine whether the mean for IPAs is significantly larger than the mean for Ales, how would this change the alternative hypothesis and p-value ? Test this hypothesis write the conclusion for the test. For questions 9.77 and 9.78 the data set is given at this text’s website. Assume that the data sets are from random samples and the distributions are Normal.
Ales vs. IPAs Data were collected on calorie content in ales and IPAs and is summarized in the following table. (Source: efficientdrinker.com) a. Does the sample data provide evidence that there is a difference in calorie content for ales and IPAs? Assume the conditions for using a t -test are satisfied. Use a significance level of 0.05 for the hypothesis test. b. If the test had been to determine whether the mean for IPAs is significantly larger than the mean for Ales, how would this change the alternative hypothesis and p-value ? Test this hypothesis write the conclusion for the test. For questions 9.77 and 9.78 the data set is given at this text’s website. Assume that the data sets are from random samples and the distributions are Normal.
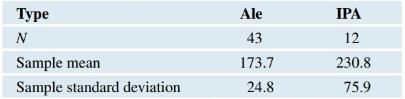
Solution Summary: The author concludes that there is a difference between the mean calorie content for ales and IPAs, at 5% level of significance.
Ales vs. IPAs Data were collected on calorie content in ales and IPAs and is summarized in the following table. (Source: efficientdrinker.com)
a. Does the sample data provide evidence that there is a difference in calorie content for ales and IPAs? Assume the conditions for using a
t
-test
are satisfied. Use a significance level of
0.05
for the hypothesis test.
b. If the test had been to determine whether the mean for IPAs is significantly larger than the mean for Ales, how would this change the alternative hypothesis and
p-value
? Test this hypothesis write the conclusion for the test.
For questions
9.77
and
9.78
the data set is given at this text’s website. Assume that the data sets are from random samples and the distributions are Normal.
Definition Definition Number of subjects or observations included in a study. A large sample size typically provides more reliable results and better representation of the population. As sample size and width of confidence interval are inversely related, if the sample size is increased, the width of the confidence interval decreases.
The following data represent total ventilation measured in liters of air per minute per square meter of body area for two independent (and randomly chosen) samples.
Analyze these data using the appropriate non-parametric hypothesis test
each column represents before & after measurements on the same individual. Analyze with the appropriate non-parametric hypothesis test for a paired design.
Should you be confident in applying your regression equation to estimate the heart rate of a python at 35°C? Why or why not?
Need a deep-dive on the concept behind this application? Look no further. Learn more about this topic, statistics and related others by exploring similar questions and additional content below.
Hypothesis Testing using Confidence Interval Approach; Author: BUM2413 Applied Statistics UMP;https://www.youtube.com/watch?v=Hq1l3e9pLyY;License: Standard YouTube License, CC-BY
Hypothesis Testing - Difference of Two Means - Student's -Distribution & Normal Distribution; Author: The Organic Chemistry Tutor;https://www.youtube.com/watch?v=UcZwyzwWU7o;License: Standard Youtube License


 Glencoe Algebra 1, Student Edition, 9780079039897...AlgebraISBN:9780079039897Author:CarterPublisher:McGraw Hill
 College Algebra (MindTap Course List)AlgebraISBN:9781305652231Author:R. David Gustafson, Jeff HughesPublisher:Cengage Learning
 Holt Mcdougal Larson Pre-algebra: Student Edition...AlgebraISBN:9780547587776Author:HOLT MCDOUGALPublisher:HOLT MCDOUGAL
 Big Ideas Math A Bridge To Success Algebra 1: Stu...AlgebraISBN:9781680331141Author:HOUGHTON MIFFLIN HARCOURTPublisher:Houghton Mifflin Harcourt