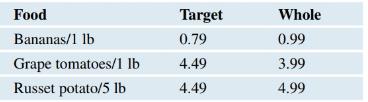
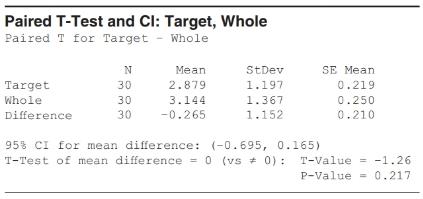
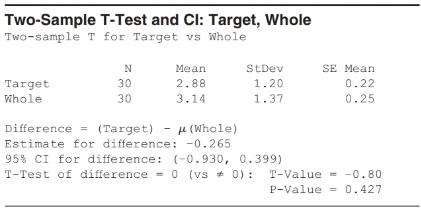
Organic Food A student compared organic food prices at Target and Whole Foods. The same items were priced at each store. The first three items are shown in Figure A. (Source: StatCrunch Organic food price comparison fall 2011. Owner: kerrypaulson) Choose the correct output (B or C) for the appropriate test, explaining why you chose that output. Then test the hypothesis that the population means are not equal using a significance level of 0.05 . Figure A Figure B Figure C
Organic Food A student compared organic food prices at Target and Whole Foods. The same items were priced at each store. The first three items are shown in Figure A. (Source: StatCrunch Organic food price comparison fall 2011. Owner: kerrypaulson) Choose the correct output (B or C) for the appropriate test, explaining why you chose that output. Then test the hypothesis that the population means are not equal using a significance level of 0.05 . Figure A Figure B Figure C
Solution Summary: The author determines the correct output for the appropriate test and provides an explanation for choosing it.
Organic Food A student compared organic food prices at Target and Whole Foods. The same items were priced at each store. The first three items are shown in Figure A. (Source: StatCrunch Organic food price comparison fall 2011. Owner: kerrypaulson) Choose the correct output (B or C) for the appropriate test, explaining why you chose that output. Then test the hypothesis that the population means are not equal using a significance level of
0.05
.
Figure A
Figure B
Figure C
Definition Definition Number of subjects or observations included in a study. A large sample size typically provides more reliable results and better representation of the population. As sample size and width of confidence interval are inversely related, if the sample size is increased, the width of the confidence interval decreases.
Examine the Variables: Carefully review and note the names of all variables in the dataset. Examples of these variables include:
Mileage (mpg)
Number of Cylinders (cyl)
Displacement (disp)
Horsepower (hp)
Research: Google to understand these variables.
Statistical Analysis: Select mpg variable, and perform the following statistical tests. Once you are done with these tests using mpg variable, repeat the same with hp
Mean
Median
First Quartile (Q1)
Second Quartile (Q2)
Third Quartile (Q3)
Fourth Quartile (Q4)
10th Percentile
70th Percentile
Skewness
Kurtosis
Document Your Results:
In RStudio: Before running each statistical test, provide a heading in the format shown at the bottom. “# Mean of mileage – Your name’s command”
In Microsoft Word: Once you've completed all tests, take a screenshot of your results in RStudio and paste it into a Microsoft Word document. Make sure that snapshots are very clear. You will need multiple snapshots. Also transfer these results to the…
Elementary Statistics: Picturing the World (7th Edition)
Knowledge Booster
Learn more about
Need a deep-dive on the concept behind this application? Look no further. Learn more about this topic, statistics and related others by exploring similar questions and additional content below.
Hypothesis Testing - Solving Problems With Proportions; Author: The Organic Chemistry Tutor;https://www.youtube.com/watch?v=76VruarGn2Q;License: Standard YouTube License, CC-BY
Hypothesis Testing and Confidence Intervals (FRM Part 1 – Book 2 – Chapter 5); Author: Analystprep;https://www.youtube.com/watch?v=vth3yZIUlGQ;License: Standard YouTube License, CC-BY


 Glencoe Algebra 1, Student Edition, 9780079039897...AlgebraISBN:9780079039897Author:CarterPublisher:McGraw Hill
 Big Ideas Math A Bridge To Success Algebra 1: Stu...AlgebraISBN:9781680331141Author:HOUGHTON MIFFLIN HARCOURTPublisher:Houghton Mifflin Harcourt
 Holt Mcdougal Larson Pre-algebra: Student Edition...AlgebraISBN:9780547587776Author:HOLT MCDOUGALPublisher:HOLT MCDOUGAL
 College Algebra (MindTap Course List)AlgebraISBN:9781305652231Author:R. David Gustafson, Jeff HughesPublisher:Cengage Learning