Loose Leaf for Elementary Statistics: A Step By Step Approach
10th Edition
ISBN: 9781260152821
Author: Bluman, Allan G.
Publisher: McGraw-Hill Education
expand_more
expand_more
format_list_bulleted
Videos
Textbook Question
Chapter 8.5, Problem 9E
For Exercises 5 through 20, assume that the variables are normally or approximately
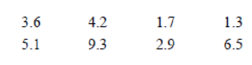
9. Distances to Supermarkets A random sample of the distances in miles 8 shoppers travel to their nearest supermarkets is shown. Test the claim at α = 0.10 that the standard deviation of the distance shoppers travel is greater than 2 miles.
Expert Solution & Answer
Want to see the full answer?
Check out a sample textbook solution
Students have asked these similar questions
A pollster randomly selected four of 10 available people.
Required:
How many different groups of 4 are possible?
What is the probability that a person is a member of a group?
Note: Round your answer to 3 decimal places.
Wind Mountain is an archaeological study area located in southwestern New Mexico. Potsherds are broken pieces of prehistoric Native American clay vessels. One type of painted ceramic vessel is called Mimbres classic black-on-white. At three different sites the number of such sherds was counted in local dwelling excavations. Test given.
Site I
Site II
Site III
63
19
60
43
34
21
23
49
51
48
11
15
16
46
26
20
31
Find .
Rothamsted Experimental Station (England) has studied wheat production since 1852. Each year many small plots of equal size but different soil/fertilizer conditions are planted with wheat. At the end of the growing season, the yield (in pounds) of the wheat on the plot is measured. Suppose for a random sample of years, one plot gave the following annual wheat production (in pounds):
4.46
4.21
4.40
4.81
2.81
2.90
4.93
3.54
4.16
4.48
3.26
4.74
4.97
4.02
4.91
2.59
Use a calculator to verify that the sample variance for this plot is . Another random sample of years for a second plot gave the following annual wheat production (in pounds):
3.89
3.81
3.95
4.07
4.01
3.73
4.02
3.78
3.72
3.96
3.62
3.76
4.02
3.73
3.94
4.03
Use a calculator to verify that the sample variance for this plot is . Suppose that we test the claim using that the population variance of annual wheat production for the first plot is larger…
Chapter 8 Solutions
Loose Leaf for Elementary Statistics: A Step By Step Approach
Ch. 8.1 - Applying the Concepts 81 Eggs and Your Health The...Ch. 8.1 - Define null and alternative hypotheses, and give...Ch. 8.1 - What is meant by a type I error? A type II error?...Ch. 8.1 - What is meant by a statistical test?Ch. 8.1 - Explain the difference between a one-tailed and a...Ch. 8.1 - What is meant by the critical region? The...Ch. 8.1 - What symbols are used to represent the null...Ch. 8.1 - What symbols are used to represent the...Ch. 8.1 - Explain what is meant by a significant difference.Ch. 8.1 - When should a one-tailed test be used? A...
Ch. 8.1 - In hypothesis testing, why cant the hypothesis be...Ch. 8.1 - Using the z table (Table E), find the critical...Ch. 8.1 - Using the z table (Table E), find the critical...Ch. 8.1 - For each conjecture, state the null and...Ch. 8.1 - For each conjecture, state the null and...Ch. 8.2 - Car Thefts You recently received a job with a...Ch. 8.2 - For Exercises 1 through 25, perform each of the...Ch. 8.2 - For Exercises 1 through 25, perform each of the...Ch. 8.2 - For Exercises 1 through 25, perform each of the...Ch. 8.2 - For Exercises 1 through 25, perform each of the...Ch. 8.2 - For Exercises 1 through 25, perform each of the...Ch. 8.2 - For Exercises 1 through 25, perform each of the...Ch. 8.2 - For Exercises 1 through 25, perform each of the...Ch. 8.2 - For Exercises 1 through 25, perform each of the...Ch. 8.2 - For Exercises 1 through 25, perform each of the...Ch. 8.2 - For Exercises 1 through 25, perform each of the...Ch. 8.2 - For Exercises 1 through 25, perform each of the...Ch. 8.2 - For Exercises 1 through 25, perform each of the...Ch. 8.2 - For Exercises 1 through 25, perform each of the...Ch. 8.2 - For Exercises 1 through 25, perform each of the...Ch. 8.2 - Reject or Not State whether the null hypothesis...Ch. 8.2 - For Exercises 1 through 25, perform each of the...Ch. 8.2 - For Exercises 1 through 25, perform each of the...Ch. 8.2 - For Exercises 1 through 25, perform each of the...Ch. 8.2 - For Exercises 1 through 25, perform each of the...Ch. 8.2 - For Exercises 1 through 25, perform each of the...Ch. 8.2 - For Exercises 1 through 25, perform each of the...Ch. 8.2 - For Exercises 1 through 25, perform each of the...Ch. 8.2 - Transmission Service A car dealer recommends that...Ch. 8.2 - Speeding Tickets A motorist claims that the South...Ch. 8.2 - Sick Days A manager states that in his factory,...Ch. 8.2 - Significance Levels Suppose a statistician chose...Ch. 8.2 - Hourly Wage The president of a company states that...Ch. 8.3 - How Much Nicotine Is in Those Cigarettes? A...Ch. 8.3 - In what ways is the t distribution similar to the...Ch. 8.3 - What are the degrees of freedom for the t test?Ch. 8.3 - Find the critical value (or values) for the t test...Ch. 8.3 - Find the critical value (or values) for the t test...Ch. 8.3 - Using Table F, find the P-value interval for each...Ch. 8.3 - Using Table F, find the P-value interval for each...Ch. 8.3 - For Exercises 7 through 23, perform each of the...Ch. 8.3 - For Exercises 7 through 23, perform each of the...Ch. 8.3 - For Exercises 7 through 23, perform each of the...Ch. 8.3 - For Exercises 7 through 23, perform each of the...Ch. 8.3 - For Exercises 7 through 23, perform each of the...Ch. 8.3 - For Exercises 7 through 23, perform each of the...Ch. 8.3 - For Exercises 7 through 23, perform each of the...Ch. 8.3 - For Exercises 7 through 23, perform each of the...Ch. 8.3 - For Exercises 7 through 23, perform each of the...Ch. 8.3 - For Exercises 7 through 23, perform each of the...Ch. 8.3 - For Exercises 7 through 23, perform each of the...Ch. 8.3 - For Exercises 7 through 23, perform each of the...Ch. 8.3 - For Exercises 7 through 23, perform each of the...Ch. 8.3 - For Exercises 7 through 23, perform each of the...Ch. 8.3 - For Exercises 7 through 23, perform each of the...Ch. 8.3 - For Exercises 7 through 23, perform each of the...Ch. 8.3 - For Exercises 7 through 23, perform each of the...Ch. 8.4 - What were the statistical hypotheses? 2. What were...Ch. 8.4 - Give three examples of proportions.Ch. 8.4 - Why is a proportion considered a binomial...Ch. 8.4 - When you are testing hypotheses by using...Ch. 8.4 - What are the mean and the standard deviation of a...Ch. 8.4 - For Exercises 5 through 20, perform each of the...Ch. 8.4 - For Exercises 5 through 20, perform each of the...Ch. 8.4 - For Exercises 5 through 20, perform each of the...Ch. 8.4 - For Exercises 5 through 20, perform each of the...Ch. 8.4 - For Exercises 5 through 20, perform each of the...Ch. 8.4 - For Exercises 5 through 20, perform each of the...Ch. 8.4 - For Exercises 5 through 20, perform each of the...Ch. 8.4 - For Exercises 5 through 20, perform each of the...Ch. 8.4 - For Exercises 5 through 20, perform each of the...Ch. 8.4 - For Exercises 5 through 20, perform each of the...Ch. 8.4 - Youth Smoking Researchers suspect that 18% of all...Ch. 8.4 - For Exercises 5 through 20, perform each of the...Ch. 8.4 - For Exercises 5 through 20, perform each of the...Ch. 8.4 - For Exercises 5 through 20, perform each of the...Ch. 8.4 - For Exercises 5 through 20, perform each of the...Ch. 8.4 - For Exercises 5 through 20, perform each of the...Ch. 8.4 - When np or nq is not 5 or more, the binomial table...Ch. 8.4 - First-Class Airline Passengers In the past, 20% of...Ch. 8.4 - Show that Z=pppqn can be derived from z=Xu by...Ch. 8.5 - Testing Gas Mileage Claims Assume that you are...Ch. 8.5 - Using Table G, find the critical value(s) for...Ch. 8.5 - Using Table G, find the critical value(s) for...Ch. 8.5 - Using Table G, find the P-value interval for each...Ch. 8.5 - Using Table G, find the P-value interval for each...Ch. 8.5 - For Exercises 5 through 20, assume that the...Ch. 8.5 - For Exercises 5 through 20, assume that the...Ch. 8.5 - For Exercises 5 through 20, assume that the...Ch. 8.5 - For Exercises 5 through 20, assume that the...Ch. 8.5 - For Exercises 5 through 20, assume that the...Ch. 8.5 - For Exercises 5 through 20, assume that the...Ch. 8.5 - Tornado Deaths A researcher claims that the...Ch. 8.5 - Interstate Speeds It has been reported that the...Ch. 8.5 - Nicotine Content of Cigarettes A manufacturer of...Ch. 8.5 - For Exercises 5 through 20, assume that the...Ch. 8.5 - For Exercises 5 through 20, assume that the...Ch. 8.5 - For Exercises 5 through 20, assume that the...Ch. 8.5 - For Exercises 5 through 20, assume that the...Ch. 8.5 - For Exercises 5 through 20, assume that the...Ch. 8.5 - For Exercises 5 through 20, assume that the...Ch. 8.5 - For Exercises 5 through 20, assume that the...Ch. 8.6 - First-Time Births According to the almanac, the...Ch. 8.6 - One-Way Airfares The average one-way airfare from...Ch. 8.6 - Prob. 3ECh. 8.6 - Prison Time According to a public service website,...Ch. 8.6 - Working at Home Workers with a formal arrangement...Ch. 8.6 - Newspaper Reading Times A survey taken several...Ch. 8.6 - Prob. 7ECh. 8.6 - How is the power of a test related to the type II...Ch. 8.6 - Prob. 9ECh. 8 - For Exercises 1 through 20, perform each of the...Ch. 8 - For Exercises 1 through 20, perform each of the...Ch. 8 - For Exercises 1 through 20, perform each of the...Ch. 8 - For Exercises 1 through 20, perform each of the...Ch. 8 - For Exercises 1 through 20, perform each of the...Ch. 8 - For Exercises 1 through 20, perform each of the...Ch. 8 - For Exercises 1 through 20, perform each of the...Ch. 8 - For Exercises 1 through 20, perform each of the...Ch. 8 - For Exercises 1 through 20, perform each of the...Ch. 8 - For Exercises 1 through 20, perform each of the...Ch. 8 - For Exercises 1 through 20, perform each of the...Ch. 8 - Prob. 8.4.12RECh. 8 - For Exercises 1 through 20, perform each of the...Ch. 8 - For Exercises 1 through 20, perform each of the...Ch. 8 - For Exercises 5 through 20, assume that the...Ch. 8 - For Exercises 5 through 20, assume that the...Ch. 8 - For Exercises 5 through 20, assume that the...Ch. 8 - For Exercises 5 through 20, assume that the...Ch. 8 - Plant Leaf Lengths A biologist knows that the...Ch. 8 - Tire Inflation To see whether people are keeping...Ch. 8 - The Data Bank is found in Appendix B, or on the...Ch. 8 - Select a random sample of 15 individuals and test...Ch. 8 - Select a random sample of at least 30 individuals,...Ch. 8 - Select a sample of 20 individuals and test the...Ch. 8 - Using the data from Data Set XIII, select a sample...Ch. 8 - Using the data obtained in Exercise 5, test the...Ch. 8 - Determine whether each statement is true or false....Ch. 8 - Determine whether each statement is true or false....Ch. 8 - Determine whether each statement is true or false....Ch. 8 - Determine whether each statement is true or false....Ch. 8 - Determine whether each statement is true or false....Ch. 8 - When the value of is increased, the probability...Ch. 8 - If you wish to test the claim that the mean of the...Ch. 8 - The degrees of freedom for the chi-square test for...Ch. 8 - For the t test, one uses _______ instead of . a. n...Ch. 8 - Complete the following statements with the best...Ch. 8 - Complete the following statements with the best...Ch. 8 - A conjecture about a population parameter is...Ch. 8 - Complete the following statements with the best...Ch. 8 - Complete the following statements with the best...Ch. 8 - For the following exercises where applicable: a....Ch. 8 - For Exercises 1 through 25, perform each of the...Ch. 8 - For Exercises 1 through 25, perform each of the...Ch. 8 - Prob. 18CQCh. 8 - Prob. 19CQCh. 8 - For Exercises 1 through 25, perform each of the...Ch. 8 - Prob. 21CQCh. 8 - Prob. 22CQCh. 8 - For the following exercises where applicable: a....Ch. 8 - For the following exercises where applicable: a....Ch. 8 - For the following exercises where applicable: a....Ch. 8 - Prob. 26CQCh. 8 - Prob. 27CQCh. 8 - Find the P-value for the z test in Exercise 16....Ch. 8 - Prob. 29CQCh. 8 - Prob. 30CQCh. 8 - For the following exercises where applicable: a....Ch. 8 - Strength of Wrapping Cord A manufacturer claims...Ch. 8 - Prob. 33CQCh. 8 - Find the 95% confidence interval for the mean in...Ch. 8 - Critical Thinking Challenges The power of a test...
Knowledge Booster


Learn more about
Need a deep-dive on the concept behind this application? Look no further. Learn more about this topic, statistics and related others by exploring similar questions and additional content below.Similar questions
- It is thought that prehistoric Native Americans did not take their best tools, pottery, and household items when they visited higher elevations for their summer camps. It is hypothesized that archaeological sites tend to lose their cultural identity and specific cultural affiliation as the elevation of the site increases. Let x be the elevation (in thousands of feet) for an archaeological site in the southwestern United States. Let y be the percentage of unidentified artifacts (no specific cultural affiliation) at a given elevation. Suppose that the following data were obtained for a collection of archaeological sites in New Mexico: x 5.50 6.00 6.75 7.00 7.75 y 37 38 92 70 99 Find the equation of the least squares line . Round a and b to three decimal places.arrow_forwardA fitness trainer wants to estimate the effect of fitness activities on muscle mass for different weight categories of club members. They choose the most popular fitness classes at the gym: yoga, circuit training, and high-intensity interval training (HIIT). Suppose that the weights of club members are separated into three levels: under 155 pounds, 155 – 200 pounds, and over 200 pounds. Draw a flow chart showing the design of this experiment.arrow_forwardThe systolic blood pressure of individuals is thought to be related to both age and weight. Let the systolic blood pressure, age, and weight be represented by the variables x1, x2, and x3, respectively. Suppose that Minitab was used to generate the following descriptive statistics, correlations, and regression analysis for a random sample of 15 individuals. Descriptive Statistics Variable N Mean Median TrMean StDev SE Mean x 1 15 154.14 154.34 154.14 3.842 0.992000 x 2 15 59.69 60.19 59.69 1.462 0.377487 x 3 15 205.55 204.75 205.55 4.558 1.176871 Variable Minimum Maximum Q1 Q3 x 1 125 178 141.803 167.244 x 2 41 80 47.754 78.415 x 3 126 240 140.395 224.008 Correlations (Pearson) x 1 x 2 x 2 0.892 x 3 0.839 0.567 Regression Analysis The regression equation is x 1 = 0.883 + 1.257x2 + 0.871x3 Predictor Coef StDev T P Constant 0.883 0.635 1.39 0.095 x 2 1.257 0.635 1.98 0.036 x 3 0.871 0.419 2.08 0.030 S = 0.428 R-sq = 92.7 %…arrow_forward
- According to health professionals, a person’s weight is expected to increase with age. To examine that statement, a nutritionist collected data from 11 random females from different age categories between the ages of 21 and 43. In the following table, x is the age of a person and y is the weight in pounds. x, age 21 24 27 29 31 33 35 38 40 42 43 y, weight in lb 121.4 122.3 130.3 131.7 133.3 134.6 136.7 138.4 140.3 142.0 145.1 Select the correct graph of the least-squares line on a scatter diagram.arrow_forwardLet x be a random variable that represents the percentage of successful free throws a professional basketball player makes in a season. Let y be a random variable that represents the percentage of successful field goals a professional basketball player makes in a season. A random sample of n = 6 professional basketball players gave the following information. x 82 69 73 84 74 64 y 42 48 46 46 46 42 Verify that ∑x =446, ∑y =270, ∑x2 =33,442, ∑y2 =12,180, ∑xy =20,070, and r = 0, and find the critical value for a test using a 5% level of significance claiming that ρis not equal than zero. Round your answer to three decimal places.arrow_forwardLet x be a random variable that represents the percentage of successful free throws a professional basketball player makes in a season. Let y be a random variable that represents the percentage of successful field goals a professional basketball player makes in a season. A random sample of n = 6 professional basketball players gave the following information. x 75 72 75 81 74 81 y 46 39 42 47 49 50 Verify that Se ࣈ 3.591,a ࣈ –10.145, bࣈ0.729, and , and find the predicted percentage of successful field goals for a player with x= 88%successful free throws. Round your answer to the nearest tenth of a percentarrow_forward
- An editor wants to analyze if there is a significant difference in the ratings of books in four different genres. Random samples of book ratings were collected for four different genres. The editor recorded ratings in a 0 to 10 scale in the following table. Fiction Novel Biography Science&Technology 8.5 8.4 6.2 9.1 5.3 5.3 5.5 4.3 7.7 4.2 7.0 9.7 5.1 9.8 9.3 5.2 6.9 8.6 6.7 7.9 4.8 7.1 6.9 8.4 Shall we reject or not reject the claim that there are no differences among the population means of book ratings for the different genres? Use.arrow_forwardPeggy conducted a study to identify the randomness of rainy days in fall. For 15 days, she recorded whether it rained that day or not. They denoted a rainy day with the letter R, a day without rain with the letter N. R N N R R N N R R N N R R R R Test the sequence for randomness. Use .arrow_forwardConsider the grades for the math and history exams for 10 students on a scale from 0 to 12 in the following table. Student Math History 1 4 8 2 5 9 3 7 9 4 12 10 5 10 8 6 8 5 7 9 6 8 9 6 9 11 9 10 7 10 Compute the Spearman correlation coefficient. Round your answer to three decimal places.arrow_forward
- To compare two elementary schools regarding teaching of reading skills, 12 sets of identical twins were used. In each case, one child was selected at random and sent to school A, and his or her twin was sent to school B. Near the end of fifth grade, an achievement test was given to each child. The results follow: Twin Pair 1 2 3 4 5 6 School A 169 157 115 99 119 113 School B 123 157 112 99 121 122 Twin Pair 7 8 9 10 11 12 School A 120 121 124 145 138 117 School B 153 90 124 140 142 102 Suppose a sign test for matched pairs with a 1% level of significance is used to test the hypothesis that the schools have the same effectiveness in teaching reading skills against the alternate hypothesis that the schools have different levels of effectiveness in teaching reading skills. Let p denote portion of positive signs when the scores of school B are subtracted from the corresponding scores of school…arrow_forwardA horse trainer teaches horses to jump by using two methods of instruction. Horses being taught by method A have a lead horse that accompanies each jump. Horses being taught by method B have no lead horse. The table shows the number of training sessions required before each horse performed the jumps properly. Method A 25 23 39 29 37 20 Method B 41 21 46 42 24 44 Method A 45 35 27 31 34 49 Method B 26 43 47 32 40 Use a rank-sum test with a5% level of significance to test the claim that there is no difference between the training sessions distributions. If the value of the sample test statistic R, the rank-sum, is 150, calculate the P-value. Round your answer to four decimal places.arrow_forwardA data processing company has a training program for new salespeople. After completing the training program, each trainee is ranked by his or her instructor. After a year of sales, the same class of trainees is again ranked by a company supervisor according to net value of the contracts they have acquired for the company. The results for a random sample of 11 salespeople trained in the last year follow, where x is rank in training class and y is rank in sales after 1 year. Lower ranks mean higher standing in class and higher net sales. Person 1 2 3 4 5 6 x rank 8 11 2 4 5 3 y rank 7 10 1 3 2 4 Person 7 8 9 10 11 x rank 7 9 10 1 6 y rank 8 11 9 6 5 Using a 1% level of significance, test the claim that the relation between x and y is monotone (either increasing or decreasing). Verify that the Spearman rank correlation coefficient . This implies that the P-value lies between 0.002 and 0.01. State…arrow_forward
arrow_back_ios
SEE MORE QUESTIONS
arrow_forward_ios
Recommended textbooks for you
 Glencoe Algebra 1, Student Edition, 9780079039897...AlgebraISBN:9780079039897Author:CarterPublisher:McGraw Hill
 Big Ideas Math A Bridge To Success Algebra 1: Stu...AlgebraISBN:9781680331141Author:HOUGHTON MIFFLIN HARCOURTPublisher:Houghton Mifflin Harcourt
Glencoe Algebra 1, Student Edition, 9780079039897...
Algebra
ISBN:9780079039897
Author:Carter
Publisher:McGraw Hill
Big Ideas Math A Bridge To Success Algebra 1: Stu...
Algebra
ISBN:9781680331141
Author:HOUGHTON MIFFLIN HARCOURT
Publisher:Houghton Mifflin Harcourt
Hypothesis Testing using Confidence Interval Approach; Author: BUM2413 Applied Statistics UMP;https://www.youtube.com/watch?v=Hq1l3e9pLyY;License: Standard YouTube License, CC-BY
Hypothesis Testing - Difference of Two Means - Student's -Distribution & Normal Distribution; Author: The Organic Chemistry Tutor;https://www.youtube.com/watch?v=UcZwyzwWU7o;License: Standard Youtube License