
Using Table G, find the critical value(s) for each. Indicate the noncritical region or regions, and state the null and alternative hypotheses. Use σ2 = 225.
a. α = 0.10, n = 14, two-tailed
b. α = 0.05, n = 27, right-tailed
c. α = 0.01, n = 9, left-tailed
d. α = 0.05, n = 17, right-tailed
a.
To find: The critical values for two tailed test.
Answer to Problem 1E
The critical values for two tailed test is 5.892 and 23.362, respectively.
Null hypothesis:
Alternative hypothesis:
Explanation of Solution
Given info:
The level of significance is
Answer:
Degrees of freedom:
The area to the right of larger value is,
From “Table G: The chi square distribution”, the critical values for the
Critical and non critical region:
Software Procedure:
Step-by-step procedure to obtain the critical region and non critical using the MINITAB software:
- Choose Graph > Probability Distribution Plot > choose View Probability> OK.
- From Distribution, choose Chi-square.
- In Degrees of freedom, enter 13.
- Click the Shaded Area tab.
- Choose Probability value and Both Tail for the region of the curve to shade.
- Enter the Probability value as 0.10.
- Click OK.
Output using the MINITAB software is given below:
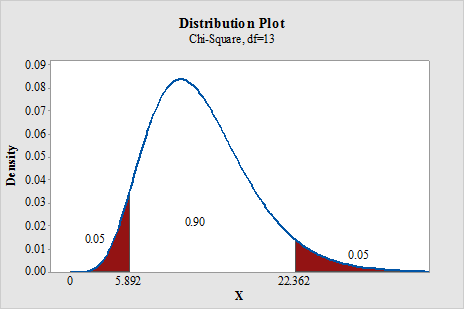
State the null and alternative hypotheses:
Here, the claim is that the population variance is 225. This can be written as
Null hypothesis:
Alternative hypothesis:
b.
To find: The critical value for right tailed test.
Answer to Problem 1E
The critical value for right tailed test is 38.885.
Null hypothesis:
Alternative hypothesis:
Explanation of Solution
Given info:
The level of significance is
Answer:
Degrees of freedom:
From “Table G: The chi square distribution”, the critical values for the
Critical and non critical region:
Software Procedure:
Step-by-step procedure to obtain the critical region and non critical using the MINITAB software:
- Choose Graph > Probability Distribution Plot > choose View Probability> OK.
- From Distribution, choose Chi-square.
- In Degrees of freedom, enter 26.
- Click the Shaded Area tab.
- Choose Probability value and Right Tail for the region of the curve to shade.
- Enter the Probability value as 0.05.
- Click OK.
Output using the MINITAB software is given below:
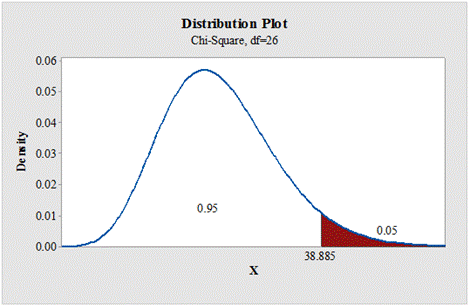
State the null and alternative hypotheses:
Null hypothesis:
Alternative hypothesis:
c.
To find: The critical value for left tailed test.
Answer to Problem 1E
The critical value for left tailed test is 1.646.
Null hypothesis:
Alternative hypothesis:
Explanation of Solution
Given info:
The level of significance is
Answer:
Degrees of freedom:
If the test is left tail, the level of significance is subtracted from 1. That is,
From “Table G: The chi square distribution”, the critical values for the
Critical and non critical region:
Software Procedure:
Step-by-step procedure to obtain the critical region and non critical using the MINITAB software:
- Choose Graph > Probability Distribution Plot > choose View Probability> OK.
- From Distribution, choose Chi-square.
- In Degrees of freedom, enter 8.
- Click the Shaded Area tab.
- Choose Probability value and Left Tail for the region of the curve to shade.
- Enter the Probability value as 0.01.
- Click OK.
Output using the MINITAB software is given below:
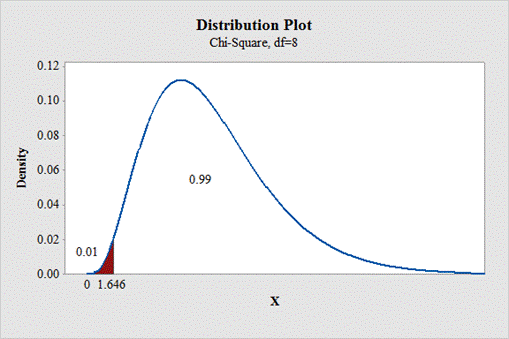
State the null and alternative hypotheses:
Null hypothesis:
Alternative hypothesis:
d.
To find: The critical value for right tailed test.
Answer to Problem 1E
The critical value for right tailed test is 26.296.
Null hypothesis:
Alternative hypothesis:
Explanation of Solution
Given info:
The level of significance is
Answer:
Degrees of freedom:
From “Table G: The chi square distribution”, the critical values for the
Critical and non critical region:
Software Procedure:
Step-by-step procedure to obtain the critical region and non critical using the MINITAB software:
- Choose Graph > Probability Distribution Plot > choose View Probability> OK.
- From Distribution, choose Chi-square.
- In Degrees of freedom, enter 16.
- Click the Shaded Area tab.
- Choose Probability value and Right Tail for the region of the curve to shade.
- Enter the Probability value as 0.05.
- Click OK.
Output using the MINITAB software is given below:
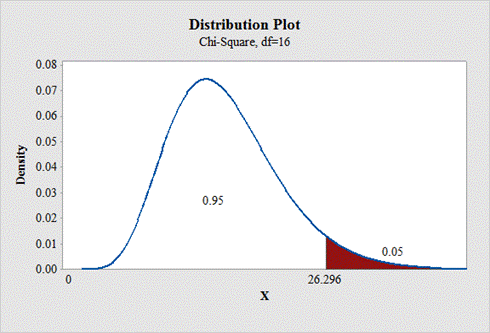
State the null and alternative hypotheses:
Null hypothesis:
Alternative hypothesis:
Want to see more full solutions like this?
Chapter 8 Solutions
Loose Leaf for Elementary Statistics: A Step By Step Approach
- (11.)Perform the test of hypotheses indicated, using the data from independent samples given. Use the p value approach. (The p-value can be only approximated.) a. Test Ho : H - Hz = 50 vs. Ha : µ, - u, > 50 @a = 0.01: = lu n1 = 30, x1 = 681 s1 = 8 n2 = 27, T2 = 625, 82 = 8 %3D b. Test Ho : 41 – Hz = 35 vs. Ha : Hi – Hy # 35@a = 0.10: n1 = 36, T1 = 325, 81 = 11 n2 = 29, T2 = 286. s2 = 7arrow_forwardIf p value = 0.01, then ... (a,b,or c) a. the null is rejected at α = 0.1. b. the null will be rejected at both α = 0.1 and α = 0.05 c. the null is rejected at α = 0.05.arrow_forward= .7 and =.6. Test Ho: (P, - P2) =0 against H,:(P, – P2)>0 using a = .05arrow_forward
- Part D. Please show TI 84 stepsarrow_forwardI. Solve for Z and find its area1. Mean = 81, score: x = 71.5, standard deviation: σ = 9.2. Mean = 47, score: x = 55.6, standard deviation: σ = 4.3. Mean = 68, score: x = 78.8, standard deviation: σ = 6.4. Mean = 51, score: x = 69, standard deviation: σ =7.5. Mean = 85, score: x = 93, standard deviation: σ =5.6. The mean expenses of Dela Cruz Family is PhP12,600 every 15 days and thestandard deviation is PhP 1, 570., If the expenses are normally distributed, what isthe probability of consuming less than PhP 11,000 in 15 days?7. The mean production of factory workers is 10 finished products per hour, with astandard deviation of 1.5 products/hour. What is the probability of finishing: a.less than 12.8 products/hour? b. more than 12 products/hour?8. The mean weight of insects for laboratory experiments is 13.2 g, with the standarddeviation of 0.8 g. What is the probability of randomly selecting insects withweight of : a. 14 g? b. 13.1 to 13.6 g?9. The lifetime of CP batteries from a…arrow_forwardGiven : The blue catfish is the largest species of North American catfish. The current world record stands at 143 pounds. According to American Expedition, the average weight of a blue catfish is between 20 to 40 pounds. Also, the largest blue catfish ever caught was at the John H. Kerr Reservoir, you believe that the mean weight of the fish in this reservoir is greater than 40 pounds. A 50 blue catfish caught at this reservoir. n = 50 α = 0 . 05 α = 0 . 05 x = 40 . 35 p o u n d s x = 40 . 35 p o u n d s s = 2 . 8 p o u n d sarrow_forward
- Let n₁ = 50, X₁ = 40, n₂ = 50, and X₂ = 20. Complete parts (a) and (b) below. a. At the 0.05 level of significance, is there evidence of a significant difference between the two population proportions? Determine the null and alternative hypotheses. Choose the correct answer below. OA. Ho: ₁2π₂ H₁: π₁ π₂ C. Ho: π₁ #1₂ H1: П1 =П2 Calculate the test statistic, ZSTAT, based on the difference P₁ - P2. The test statistic, ZSTAT, is (Type an integer or a decimal. Round to two decimal places as needed.) Calculate the p-value. O D. Ho: ₁ = π₂ H₁: π₁ #π₂ 퍼 The p-value is. (Type an integer or a decimal. Round to three decimal places as needed.)arrow_forwardPet Owners A study of pet owners showed the following information concerning the ownership of the dogs and cats. At =α0.10 , is there a relationship between the number of people in a family and dog or cat ownership? Use the critical value method with tables. 1 person 2 people 3 people 4 or more people Dog 5 15 10 25 Cat 10 15 15 15 1)State the hypotheses and identify the claim. H0: Pet ownership is ▼(DEPENDANT ON or INDEPENDANT OF?) the number of people living in the household. (CLAIM OR NOT CLAIM?) H1 : Pet ownership is (DEPENDANT ON or INDEPENDANT OF?) the number of people living in the household. (CLAIM OR NOT CLAIM?) 2. Find the critical value 3. Compute the test value: X^2= 4. Reject or Do not reject the null hypothesis 5. Summarize: Is there or is there not enough evidence to reject the claim?Is there or is there not enough evidence to support the claim?arrow_forwardFind the value of “z sub alpha” z0.15 And for z0.02arrow_forward
- Algebra & Trigonometry with Analytic GeometryAlgebraISBN:9781133382119Author:SwokowskiPublisher:Cengage
 Glencoe Algebra 1, Student Edition, 9780079039897...AlgebraISBN:9780079039897Author:CarterPublisher:McGraw Hill

