Concept explainers
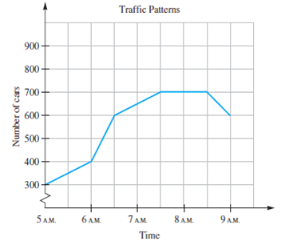
The following graph shows the relationship between the numbers of cars on a certain road and the time of day for times between

a. What was the increase in the number of cars on the road between
b. During which half hour was the increase in the number of cars the greatest?
c. What was the increase in the number of cars between
d. During which half hour(s) did the numbers of cars decrease? By how much?
e. The graph for this problem is composed of segments rather than just points. Why do you think segments are used here instead of just points?
Want to see the full answer?
Check out a sample textbook solution
Chapter 8 Solutions
A Problem Solving Approach to Mathematics for Elementary School Teachers (12th Edition)
- use a graphing utility to sketch the graph of the function and then use the graph to help identify or approximate the domain and range of the function. f(x)=xsqrt(9-(x^2))arrow_forward4. Select all of the solutions for x²+x - 12 = 0? A. -12 B. -4 C. -3 D. 3 E 4 F 12 4 of 10arrow_forward2. Select all of the polynomials with the degree of 7. A. h(x) = (4x + 2)³(x − 7)(3x + 1)4 B h(x) = (x + 7)³(2x + 1)^(6x − 5)² ☐ Ch(x)=(3x² + 9)(x + 4)(8x + 2)ª h(x) = (x + 6)²(9x + 2) (x − 3) h(x)=(-x-7)² (x + 8)²(7x + 4)³ Scroll down to see more 2 of 10arrow_forward
- 1. If all of the zeros for a polynomial are included in the graph, which polynomial could the graph represent? 100 -6 -2 0 2 100 200arrow_forward3. Select the polynomial that matches the description given: Zero at 4 with multiplicity 3 Zero at −1 with multiplicity 2 Zero at -10 with multiplicity 1 Zero at 5 with multiplicity 5 ○ A. P(x) = (x − 4)³(x + 1)²(x + 10)(x — 5)³ B - P(x) = (x + 4)³(x − 1)²(x − 10)(x + 5)³ ○ ° P(x) = (1 − 3)'(x + 2)(x + 1)"'" (x — 5)³ 51 P(r) = (x-4)³(x − 1)(x + 10)(x − 5 3 of 10arrow_forwardMatch the equation, graph, and description of transformation. Horizontal translation 1 unit right; vertical translation 1 unit up; vertical shrink of 1/2; reflection across the x axis Horizontal translation 1 unit left; vertical translation 1 unit down; vertical stretch of 2 Horizontal translation 2 units right; reflection across the x-axis Vertical translation 1 unit up; vertical stretch of 2; reflection across the x-axis Reflection across the x - axis; vertical translation 2 units down Horizontal translation 2 units left Horizontal translation 2 units right Vertical translation 1 unit down; vertical shrink of 1/2; reflection across the x-axis Vertical translation 2 units down Horizontal translation 1 unit left; vertical translation 2 units up; vertical stretch of 2; reflection across the x - axis f(x) = - =-½ ½ (x − 1)²+1 f(x) = x²-2 f(x) = -2(x+1)²+2 f(x)=2(x+1)²-1 f(x)=-(x-2)² f(x)=(x-2)² f(x) = f(x) = -2x²+1 f(x) = -x²-2 f(x) = (x+2)²arrow_forward
- What is the vertex, increasing interval, decreasing interval, domain, range, root/solution/zero, and the end behavior?arrow_forwardCalculate a (bxc) where a = i, b = j, and c = k.arrow_forwardi+2j+3k = (1,2,3) and b = -i-k. Calculate the cross product a x b where a Next calculate the area of the parallelogram spanned by a and b.arrow_forward
- The measured receptance data around two resonant picks of a structure are tabulated in the followings. Find the natural frequencies, damping ratios, and mode shapes of the structure. (30 points) (@)×10 m/N α₁₂ (@)×10 m/N w/2z (Hz) 99 0.1176 0.17531 0.1114 -0.1751i 101 -0.0302 0.2456i -0.0365 -0.2453i 103 -0.1216 0.1327i -0.1279-0.1324i 220 0.0353 0.0260i -0.0419+0.0259i 224 0.0210 0.0757i |-0.0273 +0.0756i 228 -0.0443 0.0474i 0.0382 +0.0474iarrow_forwardQ3: Define the linear functional J: H(2) R by 1(v) = a(v. v) - L(v) Let u be the unique weak solution to a(u,v) = L(v) in H() and suppose that a(...) is a symmetric bilinear form on H(2) prove that 1- u is minimizer. 2- u is unique. 3- The minimizer J(u,) can be rewritten under algebraic form u Au-ub. J(u)=u'Au- Where A. b are repictively the stiffence matrix and the load vectorarrow_forward== 1. A separable differential equation can be written in the form hy) = g(a) where h(y) is a function of y only, and g(x) is a function of r only. All of the equations below are separable. Rewrite each of these in the form h(y) = g(x), then find a general solution by integrating both sides. Determine whether the solutions you found are explicit (functions) or implicit (curves but not functions) (a) 1' = — 1/3 (b) y' = = --- Y (c) y = x(1+ y²)arrow_forward
 Glencoe Algebra 1, Student Edition, 9780079039897...AlgebraISBN:9780079039897Author:CarterPublisher:McGraw Hill
 Elementary AlgebraAlgebraISBN:9780998625713Author:Lynn Marecek, MaryAnne Anthony-SmithPublisher:OpenStax - Rice University
 Functions and Change: A Modeling Approach to Coll...AlgebraISBN:9781337111348Author:Bruce Crauder, Benny Evans, Alan NoellPublisher:Cengage Learning
 Holt Mcdougal Larson Pre-algebra: Student Edition...AlgebraISBN:9780547587776Author:HOLT MCDOUGALPublisher:HOLT MCDOUGAL
 Trigonometry (MindTap Course List)TrigonometryISBN:9781337278461Author:Ron LarsonPublisher:Cengage Learning
 Algebra: Structure And Method, Book 1AlgebraISBN:9780395977224Author:Richard G. Brown, Mary P. Dolciani, Robert H. Sorgenfrey, William L. ColePublisher:McDougal Littell


