
Intro Stats, Books a la carte Plus NEW MyLab Statistics with Pearson eText -- Access Card Package (5th Edition)
5th Edition
ISBN: 9780134210247
Author: Richard D. De Veaux, Paul Velleman, David E. Bock
Publisher: PEARSON
expand_more
expand_more
format_list_bulleted
Concept explainers
Videos
Textbook Question
Chapter 8, Problem 43E
TBill rates 2016 revisited In Exercise 41, you investigated the federal rate on 3-month Treasury bills between 1950 and 1980. The
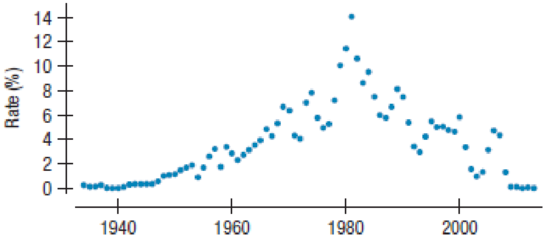
Here’s the model for the data from 1981 to 2015 (in years since 1950):
Dependent variable is Rate
R-squared = 79.1% s = 1.584
| Variable | Coefficient |
| Intercept | 8.5922 |
| Year – 1950 | –0.29646 |
- a) How does this model compare to the one in Exercise 41?
- b) What does this model estimate the interest rate will be in 2020? How does this compare to the rate you predicted in Exercise 41?
- c) Do you trust this newer predicted value? Explain.
- d) Would you use either of these models to predict the TBill rate in the future? Explain.
Expert Solution & Answer
Want to see the full answer?
Check out a sample textbook solution
Students have asked these similar questions
Posting the last part of this question
A researcher interested in explaining the level of foreign reserves for the country of Barbados estimated the following multiple regression model using yearly data spanning the period 2001 to 2016:
??=?+????+????+????
Where FR = yearly foreign reserves ($000’s), OIL = annual oil prices, EXP = yearly total exports ($000’s) and FDI = annual foreign direct investment ($000’s). The sample of data was processed using MINITAB and the following is an extract of the output obtained:
Predictor Coef StDev t-ratio p-value
Constant 5491.38 2508.81 2.1888 0.0491
OIL 85.39 18.46 4.626 0.0006
EXP -377.08 112.19 * 0.0057
FDI -396.99 160.66 -2.471 **
S = 2.45 R-sq = 96.3% R-sq(adj) = 95.3%
Analysis of Variance
Source DF SS MS…
The remaining lifetime of its clients is estimated by insurance firms using specialized (actuarial) tables. According to a National Vital Statistics Report, the regression model that calculates the extra years that American males have remaining in the country is shown below.
Years Left = 60.1- 0.65 is the regression formula (Age)
96% R-Squared
a. What is the slope?b. Find the correlation coefficient between the age and the life years left.
PLEASE I NEED HELP AS SOON AS POSSIBLE
Chapter 8 Solutions
Intro Stats, Books a la carte Plus NEW MyLab Statistics with Pearson eText -- Access Card Package (5th Edition)
Ch. 8.3 - Each of these scatterplots shows an unusual point....Ch. 8.3 - Prob. 2JCCh. 8.3 - Prob. 3JCCh. 8.7 - Prob. 4JCCh. 8.7 - Prob. 5JCCh. 8.7 - Prob. 6JCCh. 8 - Credit card spending An analysis of spending by a...Ch. 8 - Prob. 2ECh. 8 - Prob. 3ECh. 8 - Prob. 4E
Ch. 8 - Prob. 5ECh. 8 - Prob. 6ECh. 8 - Prob. 7ECh. 8 - Prob. 8ECh. 8 - Prob. 9ECh. 8 - Prob. 10ECh. 8 - Skinned knees There is a strong correlation...Ch. 8 - Prob. 12ECh. 8 - Prob. 13ECh. 8 - Average GPA An athletic director proudly states...Ch. 8 - Prob. 15ECh. 8 - Prob. 16ECh. 8 - BK protein Recall the data about the Burger King...Ch. 8 - Prob. 18ECh. 8 - Prob. 19ECh. 8 - Prob. 20ECh. 8 - Prob. 21ECh. 8 - Prob. 22ECh. 8 - Prob. 23ECh. 8 - Prob. 24ECh. 8 - Good model? In justifying his choice of a model, a...Ch. 8 - Prob. 26ECh. 8 - Movie dramas Heres a scatterplot of the production...Ch. 8 - Prob. 28ECh. 8 - Oakland passengers 2016 The scatterplot below...Ch. 8 - Prob. 30ECh. 8 - Unusual points Each of these four scatterplots...Ch. 8 - More unusual points Each of the following...Ch. 8 - Prob. 33ECh. 8 - Prob. 34ECh. 8 - Prob. 35ECh. 8 - Whats the effect? A researcher studying violent...Ch. 8 - Reading To measure progress in reading ability,...Ch. 8 - Prob. 38ECh. 8 - Heating After keeping track of his heating...Ch. 8 - Speed How does the speed at which you drive affect...Ch. 8 - Prob. 41ECh. 8 - Prob. 42ECh. 8 - TBill rates 2016 revisited In Exercise 41, you...Ch. 8 - Prob. 44ECh. 8 - Prob. 45ECh. 8 - Prob. 46ECh. 8 - Elephants and hippos We removed humans from the...Ch. 8 - Prob. 48ECh. 8 - Prob. 49ECh. 8 - Prob. 50ECh. 8 - Prob. 51ECh. 8 - Prob. 52ECh. 8 - Inflation 2016 The Consumer Price Index (CPI)...Ch. 8 - Prob. 54ECh. 8 - Prob. 55ECh. 8 - Prob. 56ECh. 8 - Prob. 57ECh. 8 - Prob. 58ECh. 8 - Prob. 59ECh. 8 - Prob. 60ECh. 8 - Prob. 61ECh. 8 - Prob. 62ECh. 8 - Prob. 63ECh. 8 - Boyle Scientist Robert Boyle examined the...Ch. 8 - Brakes The following table shows stopping...Ch. 8 - Pendulum A student experimenting with a pendulum...Ch. 8 - Planets Here is a table of the 9 sun-orbiting...Ch. 8 - Is Pluto a planet? Lets look again at the pattern...Ch. 8 - Planets and asteroids The asteroid belt between...Ch. 8 - Prob. 71ECh. 8 - Prob. 72ECh. 8 - Logs (not logarithms) The value of a log is based...Ch. 8 - Prob. 74ECh. 8 - Life expectancy history The table gives the Life...Ch. 8 - Prob. 76ECh. 8 - Prob. 77ECh. 8 - Prob. 78ECh. 8 - Prob. 79ECh. 8 - Prob. 80E
Knowledge Booster


Learn more about
Need a deep-dive on the concept behind this application? Look no further. Learn more about this topic, statistics and related others by exploring similar questions and additional content below.Similar questions
- What does the y -intercept on the graph of a logistic equation correspond to for a population modeled by that equation?arrow_forwardThe U.S. Census tracks the percentage of persons 25 years or older who are college graduates. That data forseveral years is given in Table 4[14]. Determine whether the trend appears linear. If so, and assuming the trendcontinues. in what year will the percentage exceed 35%?arrow_forwardOlympic Pole Vault The graph in Figure 7 indicates that in recent years the winning Olympic men’s pole vault height has fallen below the value predicted by the regression line in Example 2. This might have occurred because when the pole vault was a new event there was much room for improvement in vaulters’ performances, whereas now even the best training can produce only incremental advances. Let’s see whether concentrating on more recent results gives a better predictor of future records. (a) Use the data in Table 2 (page 176) to complete the table of winning pole vault heights shown in the margin. (Note that we are using x=0 to correspond to the year 1972, where this restricted data set begins.) (b) Find the regression line for the data in part ‚(a). (c) Plot the data and the regression line on the same axes. Does the regression line seem to provide a good model for the data? (d) What does the regression line predict as the winning pole vault height for the 2012 Olympics? Compare this predicted value to the actual 2012 winning height of 5.97 m, as described on page 177. Has this new regression line provided a better prediction than the line in Example 2?arrow_forward
- What is regression analysis? Describe the process of performing regression analysis on a graphing utility.arrow_forwardLife Expectancy The following table shows the average life expectancy, in years, of a child born in the given year42 Life expectancy 2005 77.6 2007 78.1 2009 78.5 2011 78.7 2013 78.8 a. Find the equation of the regression line, and explain the meaning of its slope. b. Plot the data points and the regression line. c. Explain in practical terms the meaning of the slope of the regression line. d. Based on the trend of the regression line, what do you predict as the life expectancy of a child born in 2019? e. Based on the trend of the regression line, what do you predict as the life expectancy of a child born in 1580?2300arrow_forwardTable 2 shows a recent graduate’s credit card balance each month after graduation. a. Use exponential regression to fit a model to these data. b. If spending continues at this rate, what will the graduate’s credit card debt be one year after graduating?arrow_forward
- Table 6 shows the year and the number ofpeople unemployed in a particular city for several years. Determine whether the trend appears linear. If so, and assuming the trend continues, in what year will the number of unemployed reach 5 people?arrow_forwardCable TV The following table shows the number C. in millions, of basic subscribers to cable TV in the indicated year These data are from the Statistical Abstract of the United States. Year 1975 1980 1985 1990 1995 2000 C 9.8 17.5 35.4 50.5 60.6 60.6 a. Use regression to find a logistic model for these data. b. By what annual percentage would you expect the number of cable subscribers to grow in the absence of limiting factors? c. The estimated number of subscribers in 2005 was 65.3million. What light does this shed on the model you found in part a?arrow_forwardFind the equation of the regression line for the following data set. x 1 2 3 y 0 3 4arrow_forward
- XYZ Corporation Stock Prices The following table shows the average stock price, in dollars, of XYZ Corporation in the given month. Month Stock price January 2011 43.71 February 2011 44.22 March 2011 44.44 April 2011 45.17 May 2011 45.97 a. Find the equation of the regression line. Round the regression coefficients to three decimal places. b. Plot the data points and the regression line. c. Explain in practical terms the meaning of the slope of the regression line. d. Based on the trend of the regression line, what do you predict the stock price to be in January 2012? January 2013?arrow_forwardFind the mean hourly cost when the cell phone described above is used for 240 minutes.arrow_forwardYou are studying the relationship between age and lung function measured as forced expiratory volume in 1 min. In a regression analysis is lung function the best option for Y? O Yes O Noarrow_forward
arrow_back_ios
SEE MORE QUESTIONS
arrow_forward_ios
Recommended textbooks for you
 Glencoe Algebra 1, Student Edition, 9780079039897...AlgebraISBN:9780079039897Author:CarterPublisher:McGraw Hill
 Functions and Change: A Modeling Approach to Coll...AlgebraISBN:9781337111348Author:Bruce Crauder, Benny Evans, Alan NoellPublisher:Cengage Learning
 College AlgebraAlgebraISBN:9781305115545Author:James Stewart, Lothar Redlin, Saleem WatsonPublisher:Cengage Learning
 Big Ideas Math A Bridge To Success Algebra 1: Stu...AlgebraISBN:9781680331141Author:HOUGHTON MIFFLIN HARCOURTPublisher:Houghton Mifflin Harcourt
 Algebra and Trigonometry (MindTap Course List)AlgebraISBN:9781305071742Author:James Stewart, Lothar Redlin, Saleem WatsonPublisher:Cengage Learning
Glencoe Algebra 1, Student Edition, 9780079039897...
Algebra
ISBN:9780079039897
Author:Carter
Publisher:McGraw Hill
Functions and Change: A Modeling Approach to Coll...
Algebra
ISBN:9781337111348
Author:Bruce Crauder, Benny Evans, Alan Noell
Publisher:Cengage Learning
College Algebra
Algebra
ISBN:9781305115545
Author:James Stewart, Lothar Redlin, Saleem Watson
Publisher:Cengage Learning
Big Ideas Math A Bridge To Success Algebra 1: Stu...
Algebra
ISBN:9781680331141
Author:HOUGHTON MIFFLIN HARCOURT
Publisher:Houghton Mifflin Harcourt
Algebra and Trigonometry (MindTap Course List)
Algebra
ISBN:9781305071742
Author:James Stewart, Lothar Redlin, Saleem Watson
Publisher:Cengage Learning
Correlation Vs Regression: Difference Between them with definition & Comparison Chart; Author: Key Differences;https://www.youtube.com/watch?v=Ou2QGSJVd0U;License: Standard YouTube License, CC-BY
Correlation and Regression: Concepts with Illustrative examples; Author: LEARN & APPLY : Lean and Six Sigma;https://www.youtube.com/watch?v=xTpHD5WLuoA;License: Standard YouTube License, CC-BY