
Intro Stats, Books a la carte Plus NEW MyLab Statistics with Pearson eText -- Access Card Package (5th Edition)
5th Edition
ISBN: 9780134210247
Author: Richard D. De Veaux, Paul Velleman, David E. Bock
Publisher: PEARSON
expand_more
expand_more
format_list_bulleted
Concept explainers
Videos
Textbook Question
Chapter 8, Problem 39E
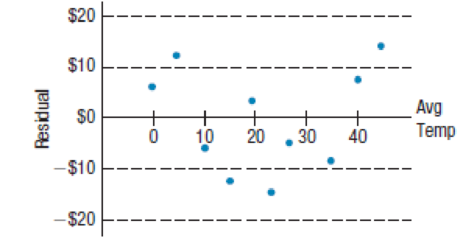
Heating After keeping track of his heating expenses for several winters, a homeowner believes he can estimate the monthly cost from the average daily Fahrenheit temperature by using the model
- a) Interpret the slope of the line in this context.
- b) Interpret the y-intercept of the line in this context.
- c) During months when the temperature stays around freezing, would you expect cost predictions based on this model to be accurate, too low, or too high? Explain.
- d) What heating cost does the model predict for a month that averages 10°?
- e) During one of the months on which the model was based, the temperature did average 10°. What were the actual heating costs for that month?
- f) Should the homeowner use this model? Explain.
- g) Would this model be more successful if the temperature were expressed in degrees Celsius? Explain.
Expert Solution & Answer
Want to see the full answer?
Check out a sample textbook solution
Students have asked these similar questions
1.2.17. (!) Let G,, be the graph whose vertices are the permutations of (1,..., n}, with
two permutations a₁, ..., a,, and b₁, ..., b, adjacent if they differ by interchanging a pair
of adjacent entries (G3 shown below). Prove that G,, is connected.
132
123
213
312
321
231
You are planning an experiment to determine the effect of the brand of gasoline and the weight of a car on gas mileage measured in miles per gallon. You will use a single test car, adding weights so that its total weight is 3000, 3500, or 4000 pounds. The car will drive on a test track at each weight using each of Amoco, Marathon, and Speedway gasoline. Which is the best way to organize the study?
Start with 3000 pounds and Amoco and run the car on the test track. Then do 3500 and 4000 pounds. Change to Marathon and go through the three weights in order. Then change to Speedway and do the three weights in order once more.
Start with 3000 pounds and Amoco and run the car on the test track. Then change to Marathon and then to Speedway without changing the weight. Then add weights to get 3500 pounds and go through the three gasolines in the same order.Then change to 4000 pounds and do the three gasolines in order again.
Choose a gasoline at random, and run the car with this gasoline at…
AP1.2 A child is 40 inches tall, which places her at the 90th percentile of all children of similar age. The heights for children of this age form an approximately Normal distribution with a mean of 38 inches. Based on this information, what is the standard deviation of the heights of all children of this age?
0.20 inches (c) 0.65 inches (e) 1.56 inches
0.31 inches (d) 1.21 inches
Chapter 8 Solutions
Intro Stats, Books a la carte Plus NEW MyLab Statistics with Pearson eText -- Access Card Package (5th Edition)
Ch. 8.3 - Each of these scatterplots shows an unusual point....Ch. 8.3 - Prob. 2JCCh. 8.3 - Prob. 3JCCh. 8.7 - Prob. 4JCCh. 8.7 - Prob. 5JCCh. 8.7 - Prob. 6JCCh. 8 - Credit card spending An analysis of spending by a...Ch. 8 - Prob. 2ECh. 8 - Prob. 3ECh. 8 - Prob. 4E
Ch. 8 - Prob. 5ECh. 8 - Prob. 6ECh. 8 - Prob. 7ECh. 8 - Prob. 8ECh. 8 - Prob. 9ECh. 8 - Prob. 10ECh. 8 - Skinned knees There is a strong correlation...Ch. 8 - Prob. 12ECh. 8 - Prob. 13ECh. 8 - Average GPA An athletic director proudly states...Ch. 8 - Prob. 15ECh. 8 - Prob. 16ECh. 8 - BK protein Recall the data about the Burger King...Ch. 8 - Prob. 18ECh. 8 - Prob. 19ECh. 8 - Prob. 20ECh. 8 - Prob. 21ECh. 8 - Prob. 22ECh. 8 - Prob. 23ECh. 8 - Prob. 24ECh. 8 - Good model? In justifying his choice of a model, a...Ch. 8 - Prob. 26ECh. 8 - Movie dramas Heres a scatterplot of the production...Ch. 8 - Prob. 28ECh. 8 - Oakland passengers 2016 The scatterplot below...Ch. 8 - Prob. 30ECh. 8 - Unusual points Each of these four scatterplots...Ch. 8 - More unusual points Each of the following...Ch. 8 - Prob. 33ECh. 8 - Prob. 34ECh. 8 - Prob. 35ECh. 8 - Whats the effect? A researcher studying violent...Ch. 8 - Reading To measure progress in reading ability,...Ch. 8 - Prob. 38ECh. 8 - Heating After keeping track of his heating...Ch. 8 - Speed How does the speed at which you drive affect...Ch. 8 - Prob. 41ECh. 8 - Prob. 42ECh. 8 - TBill rates 2016 revisited In Exercise 41, you...Ch. 8 - Prob. 44ECh. 8 - Prob. 45ECh. 8 - Prob. 46ECh. 8 - Elephants and hippos We removed humans from the...Ch. 8 - Prob. 48ECh. 8 - Prob. 49ECh. 8 - Prob. 50ECh. 8 - Prob. 51ECh. 8 - Prob. 52ECh. 8 - Inflation 2016 The Consumer Price Index (CPI)...Ch. 8 - Prob. 54ECh. 8 - Prob. 55ECh. 8 - Prob. 56ECh. 8 - Prob. 57ECh. 8 - Prob. 58ECh. 8 - Prob. 59ECh. 8 - Prob. 60ECh. 8 - Prob. 61ECh. 8 - Prob. 62ECh. 8 - Prob. 63ECh. 8 - Boyle Scientist Robert Boyle examined the...Ch. 8 - Brakes The following table shows stopping...Ch. 8 - Pendulum A student experimenting with a pendulum...Ch. 8 - Planets Here is a table of the 9 sun-orbiting...Ch. 8 - Is Pluto a planet? Lets look again at the pattern...Ch. 8 - Planets and asteroids The asteroid belt between...Ch. 8 - Prob. 71ECh. 8 - Prob. 72ECh. 8 - Logs (not logarithms) The value of a log is based...Ch. 8 - Prob. 74ECh. 8 - Life expectancy history The table gives the Life...Ch. 8 - Prob. 76ECh. 8 - Prob. 77ECh. 8 - Prob. 78ECh. 8 - Prob. 79ECh. 8 - Prob. 80E
Knowledge Booster


Learn more about
Need a deep-dive on the concept behind this application? Look no further. Learn more about this topic, statistics and related others by exploring similar questions and additional content below.Similar questions
- AP1.1 You look at real estate ads for houses in Sarasota, Florida. Many houses range from $200,000 to $400,000 in price. The few houses on the water, however, have prices up to $15 million. Which of the following statements best describes the distribution of home prices in Sarasota? The distribution is most likely skewed to the left, and the mean is greater than the median. The distribution is most likely skewed to the left, and the mean is less than the median. The distribution is roughly symmetric with a few high outliers, and the mean is approximately equal to the median. The distribution is most likely skewed to the right, and the mean is greater than the median. The distribution is most likely skewed to the right, and the mean is less than the median.arrow_forwardDuring busy political seasons, many opinion polls are conducted. In apresidential race, how do you think the participants in polls are generally selected?Discuss any issues regarding simple random, stratified, systematic, cluster, andconvenience sampling in these polls. What about other types of polls, besides political?arrow_forwardPlease could you explain why 0.5 was added to each upper limpit of the intervals.Thanksarrow_forward
- 28. (a) Under what conditions do we say that two random variables X and Y are independent? (b) Demonstrate that if X and Y are independent, then it follows that E(XY) = E(X)E(Y); (e) Show by a counter example that the converse of (ii) is not necessarily true.arrow_forward1. Let X and Y be random variables and suppose that A = F. Prove that Z XI(A)+YI(A) is a random variable.arrow_forward30. (a) What is meant by the term "product measur"? ANDarrow_forward
arrow_back_ios
SEE MORE QUESTIONS
arrow_forward_ios
Recommended textbooks for you
 Glencoe Algebra 1, Student Edition, 9780079039897...AlgebraISBN:9780079039897Author:CarterPublisher:McGraw Hill
 Algebra & Trigonometry with Analytic GeometryAlgebraISBN:9781133382119Author:SwokowskiPublisher:Cengage
 Algebra and Trigonometry (MindTap Course List)AlgebraISBN:9781305071742Author:James Stewart, Lothar Redlin, Saleem WatsonPublisher:Cengage Learning
 College AlgebraAlgebraISBN:9781305115545Author:James Stewart, Lothar Redlin, Saleem WatsonPublisher:Cengage Learning
 Algebra: Structure And Method, Book 1AlgebraISBN:9780395977224Author:Richard G. Brown, Mary P. Dolciani, Robert H. Sorgenfrey, William L. ColePublisher:McDougal Littell
Glencoe Algebra 1, Student Edition, 9780079039897...
Algebra
ISBN:9780079039897
Author:Carter
Publisher:McGraw Hill
Algebra & Trigonometry with Analytic Geometry
Algebra
ISBN:9781133382119
Author:Swokowski
Publisher:Cengage
Algebra and Trigonometry (MindTap Course List)
Algebra
ISBN:9781305071742
Author:James Stewart, Lothar Redlin, Saleem Watson
Publisher:Cengage Learning
College Algebra
Algebra
ISBN:9781305115545
Author:James Stewart, Lothar Redlin, Saleem Watson
Publisher:Cengage Learning
Algebra: Structure And Method, Book 1
Algebra
ISBN:9780395977224
Author:Richard G. Brown, Mary P. Dolciani, Robert H. Sorgenfrey, William L. Cole
Publisher:McDougal Littell
Correlation Vs Regression: Difference Between them with definition & Comparison Chart; Author: Key Differences;https://www.youtube.com/watch?v=Ou2QGSJVd0U;License: Standard YouTube License, CC-BY
Correlation and Regression: Concepts with Illustrative examples; Author: LEARN & APPLY : Lean and Six Sigma;https://www.youtube.com/watch?v=xTpHD5WLuoA;License: Standard YouTube License, CC-BY