Concept explainers
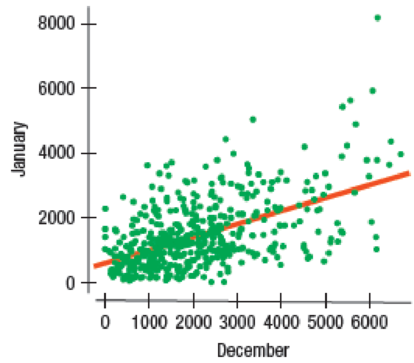
Credit card spending An analysis of spending by a sample of credit card bank cardholders shows that spending by cardholders in January (Jan) is related to their spending in December (Dec):

The assumptions and conditions of the linear regression seemed to be satisfied and an analyst was about to predict January spending using the model
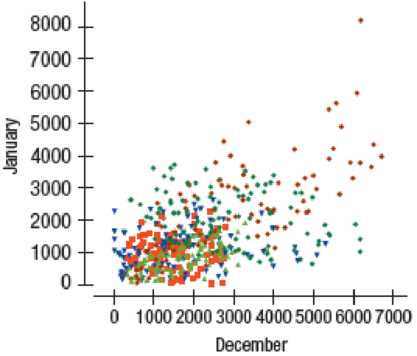
Another analyst worried that different types of cardholders might behave differently. She examined the spending patterns of the cardholders and placed them into five market Segments. When she plotted the data using different colors and symbols for the five different segments, she found the following:

Look at this plot carefully and discuss why she might be worried about the predictions from the model
Being worried to make a prediction from the model
Explanation of Solution
Given info:
A scatterplot of spending for a sample of credit card bank cardholders in January and in December is given. The corresponding regression model to predict January spending from December spending is
Another scatterplot of spending for a sample of credit card bank cardholders in January and that in December for five market segments is given.
Justification:
The conditions for a scatterplot that is well-fitted for the data is as follows:
- Straight enough condition: The relationship between y and x is straight enough to proceed with a linear regression model.
- Outlier condition: No outlier must be there which influences the fit of the least square line.
- Thickness condition: The spread of the data around the generally straight relationship seems to be consistent for all values of x.
The different segments are not scattered at random throughout the scatterplot.
Thus, the spread of the data is not consistent for all values of December and each segment may have a different relationship that might affect the accuracy of the model to predict.
The relationship between the spending of credit card bank cardholders in January and in December is not straight enough to proceed with a linear regression model.
Want to see more full solutions like this?
Chapter 8 Solutions
Intro Stats, Books a la carte Plus NEW MyLab Statistics with Pearson eText -- Access Card Package (5th Edition)
- explain the difference between the confident interval and the confident level. provide an example to show how to correctly interpret a confidence interval.arrow_forwardSketch to scale the orbit of Earth about the sun. Graph Icarus’ orbit on the same set of axesWhile the sun is the center of Earth’s orbit, it is a focus of Icarus’ orbit. There aretwo points of intersection on the graph. Based on the graph, what is the approximate distance between the two points of intersection (in AU)?arrow_forwardThe diameters of ball bearings are distributed normally. The mean diameter is 67 millimeters and the standard deviation is 3 millimeters. Find the probability that the diameter of a selected bearing is greater than 63 millimeters. Round to four decimal places.arrow_forward
- Suppose you like to keep a jar of change on your desk. Currently, the jar contains the following: 22 Pennies 27 Dimes 9 Nickels 30 Quarters What is the probability that you reach into the jar and randomly grab a penny and then, without replacement, a dime? Express as a fraction or a decimal number rounded to four decimal places.arrow_forwardA box contains 14 large marbles and 10 small marbles. Each marble is either green or white. 9 of the large marbles are green, and 4 of the small marbles are white. If a marble is randomly selected from the box, what is the probability that it is small or white? Express as a fraction or a decimal number rounded to four decimal places.arrow_forwardCan I get help with this step please? At a shooting range, instructors can determine if a shooter is consistently missing the target because of the gun sight or because of the shooter's ability. If a gun's sight is off, the variance of the distances between the shots and the center of the shot pattern will be small (even if the shots are not in the center of the target). A student claims that it is the sight that is off, not his aim, and wants the instructor to confirm his claim. If a skilled shooter fires a gun at a target multiple times, the distances between the shots and the center of the shot pattern, measured in centimeters (cm), will have a variance of less than 0.33. After the student shoots 28 shots at the target, the instructor calculates that the distances between his shots and the center of the shot pattern, measured in cm, have a variance of 0.25. Does this evidence support the student's claim that the gun's sight is off? Use a 0.025 level of significance. Assume that the…arrow_forward
- The National Academy of Science reported that 38% of research in mathematics is published by US authors. The mathematics chairperson of a prestigious university wishes to test the claim that this percentage is no longer 38%. He has no indication of whether the percentage has increased or decreased since that time. He surveys a simple random sample of 279 recent articles published by reputable mathematics research journals and finds that 123 of these articles have US authors. Does this evidence support the mathematics chairperson's claim that the percentage is no longer 38 % ? Use a 0.02 level of significance. Compute the value of the test statistic. Round to two decimal places.arrow_forwardA marketing research company desires to know the mean consumption of milk per week among males over age 32. They believe that the milk consumption has a mean of 4 liters, and want to construct a 98% confidence interval with a maximum error of 0.07 liters. Assuming a variance of 0.64 liters, what is the minimum number of males over age 32 they must include in their sample? Round up to the next integer.arrow_forwardSuppose GRE Verbal scores are normally distributed with a mean of 461 and a standard deviation of 118. A university plans to recruit students whose scores are in the top 4 % . What is the minimum score required for recruitment? Round to the nearest whole number, if necessaryarrow_forward
- Need help with my homework thank you random sample of 6 fields of durum wheat has a mean yield of 45.5 bushels per acre and standard deviation of 7.43 bushels per acre. Determine the 80 % confidence interval for the true mean yield. Assume the population is approximately normal. Step 1: Find the critical value that should be used in constructing the confidence interval. Round to three decimal places. Step 2 of 2: Construct the 80% confidence interval. Round to one decimal place. I got 1.476 as my critical value and 41.0 and 49.9 as my confidence intervalarrow_forwardCan someone check my work? If you draw a card with a value of four or less from a standard deck of cards, I will pay you $14. If not, you pay me $8. (Aces are considered the highest card in the deck.) Step 1 of 2: Find the expected value of the proposition. Round to two decimal places. Losses must be expressed as negative values. PT 2: If you played this game 718 times how much would you expect to win or lose? Round your answer to two decimal places. Losses must be expressed as negative values. for part 1 I got -2.92 pt 2 -2097.56arrow_forwardThe following table describes the distribution of a random sample S of 200 individuals, arranged by education level and income. Income(Dollars per Year) < High School High School Diploma Some College Bachelor’s Degree Graduate Degree Post-Graduate Degree 0-25,000 12 8 3 2 1 0 25,000-50,000 7 12 9 12 11 2 50,000-75,000 1 3 4 6 14 5 75,000-100,000 0 2 1 8 11 8 100,000-125,000 0 1 1 4 8 9 125,000-150,000 0 0 2 3 7 12 150,000+ 0 0 1 1 3 6 Let events be defined as follows: A = the event the subject makes 0-25,000 dollars per yearB = the event the subject makes 25,000-50,000 dollars per year C = the event the subject makes 50,000-75,000 dollars per yearD = the event the subject makes 75,000-100,000 dollars per yearE = the event the subject makes 100,000-125,000 dollars per yearF = the event the subject makes 125,000-150,000 dollars per yearG = the event…arrow_forward
 Big Ideas Math A Bridge To Success Algebra 1: Stu...AlgebraISBN:9781680331141Author:HOUGHTON MIFFLIN HARCOURTPublisher:Houghton Mifflin Harcourt
 Glencoe Algebra 1, Student Edition, 9780079039897...AlgebraISBN:9780079039897Author:CarterPublisher:McGraw Hill
 College AlgebraAlgebraISBN:9781305115545Author:James Stewart, Lothar Redlin, Saleem WatsonPublisher:Cengage Learning
 Functions and Change: A Modeling Approach to Coll...AlgebraISBN:9781337111348Author:Bruce Crauder, Benny Evans, Alan NoellPublisher:Cengage Learning
 Algebra and Trigonometry (MindTap Course List)AlgebraISBN:9781305071742Author:James Stewart, Lothar Redlin, Saleem WatsonPublisher:Cengage Learning


