
Concept explainers
Videos
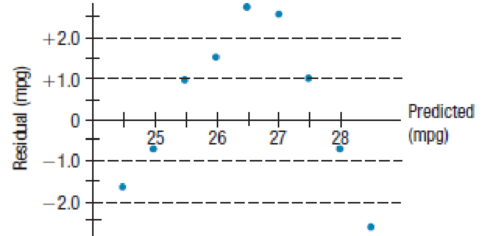
Speed How does the speed at which you drive affect your fuel economy? To find out, researchers drove a compact car for 200 miles at speeds
- a) Interpret the slope of this line in context.
- b) Explain why it’s silly to attach any meaning to the y-intercept.
- c) When this model predicts high Fuel Efficiency, what can you say about those predictions?
- d) What Fuel Efficiency does the model predict when the car is driven at 50 mph?
- e) What was the actual Fuel Efficiency when the car was driven at 45 mph?
- f) Do you think there appears to be a strong association between Speed and Fuel Efficiency? Explain.
- g) Do you think this is the appropriate model for that association? Explain.
Want to see the full answer?
Check out a sample textbook solution
Chapter 8 Solutions
Intro Stats, Books a la carte Plus NEW MyLab Statistics with Pearson eText -- Access Card Package (5th Edition)


- The slope of the roof shown here is measured with a 12” level and a ruler. What is the slope of this roof?arrow_forwardFind the x-intercept and y-intercept on the line shown. .arrow_forwardGrass buffer strips are grassy areas that are planted between bodies of water and agricultural fields. These strips are designed to filter out sediment, organic material, nutrients, and chemicals carried in runoff water. The figure [SEE PHOTO A] below shows a cross-sectional view of a grass buffer strip that has been planted along the side of a stream. A study in Nebraska investigated the use of buffer strips of several widths between 5 feet and 15 feet. The study results indicated a linear relationship between the width of the grass strip (x), in feet, and the amount of nitrogen removed from the runoff water (y), in parts per hundred. The following model was estimated. yˆ = 33.8 + 3.6x (a) Interpret the slope of the regression line in the context of this question. (b) Would you be willing to use this model to predict the amount of nitrogen removed for grass buffer strips with widths between 0 feet and 30 feet? Explain why or why not. A scientist in California wants to know if there is…arrow_forward
- Grass buffer strips are grassy areas that are planted between bodies of water and agricultural fields. These strips are designed to filter out sediment, organic material, nutrients, and chemicals carried in runoff water. The figure [SEE PHOTO A] below shows a cross-sectional view of a grass buffer strip that has been planted along the side of a stream. A study in Nebraska investigated the use of buffer strips of several widths between 5 feet and 15 feet. The study results indicated a linear relationship between the width of the grass strip (x), in feet, and the amount of nitrogen removed from the runoff water (y), in parts per hundred. The following model was estimated. yˆ = 33.8 + 3.6x A scientist in California wants to know if there is a similar relationship in her area. To investigate this, she will place a grass buffer strip between a field and a nearby stream at each of eight different locations and measure the amount of nitrogen that the grass buffer strip removes, in parts per…arrow_forwardThe table gives a set of readings obtained when a mass (x) in grams, is hung from a spring, causing it to extend to a length (y) in centimeters. Calculate the equation of the straight line that best represents the data give Mass (x) Length (y) 10 116 40 123 80 144 100 152 120 160 150 173arrow_forwardUsing the weights (lb) and highway fuel consumption amounts (mi/gal) of the 48 cars listed in the accompanying data set, one gets this regression equation: y = 58.9-0.00749x, where x represents weight. Complete parts (a) through (d). Click the icon to view the car data. The site to your captio V.UVITU. D. The slope is -0.00749 and the y-intercept is 58.9. c. What is the predictor variable? ... OA. The predictor variable is highway fuel consumption, which is represented by x. OB. The predictor variable is highway fuel consumption, which is represented by y. C. The predictor variable is weight, which is represented by x. OD. The predictor variable is weight, which is represented by y. d. Assuming that there is a significant linear correlation between weight and highway fuel consumption, what is the best predicted value for a car that weighs 2994 lb? The best predicted value of highway fuel consumption of a car that weighs 2994 lb is (Round to one decimal place as needed.) mi/gal.arrow_forward
 Algebra & Trigonometry with Analytic GeometryAlgebraISBN:9781133382119Author:SwokowskiPublisher:Cengage
 Glencoe Algebra 1, Student Edition, 9780079039897...AlgebraISBN:9780079039897Author:CarterPublisher:McGraw Hill
 Holt Mcdougal Larson Pre-algebra: Student Edition...AlgebraISBN:9780547587776Author:HOLT MCDOUGALPublisher:HOLT MCDOUGAL
 Elementary AlgebraAlgebraISBN:9780998625713Author:Lynn Marecek, MaryAnne Anthony-SmithPublisher:OpenStax - Rice University