
The degree of clinical agreement among physicians on the presence or absence of generalized lymphadenopathy was assessed in 32 randomly selected participants from a prospective study of male sexual contacts of men with acquired immunodeficiency syndrome (AIDS) or an AIDS-related condition (ARC) [8]. The total number of palpable lymph nodes was assessed by each of three physicians. Results from two of the three physicians are presented in Table 8.15.
Compute a 95% CI for the true mean difference between observers. How does it relate to your answer to Problem 8.41?
Table 8.15 Reproducibility of assessment of number of palpable lymph nodes among sexual contacts of AIDS or ARC patients
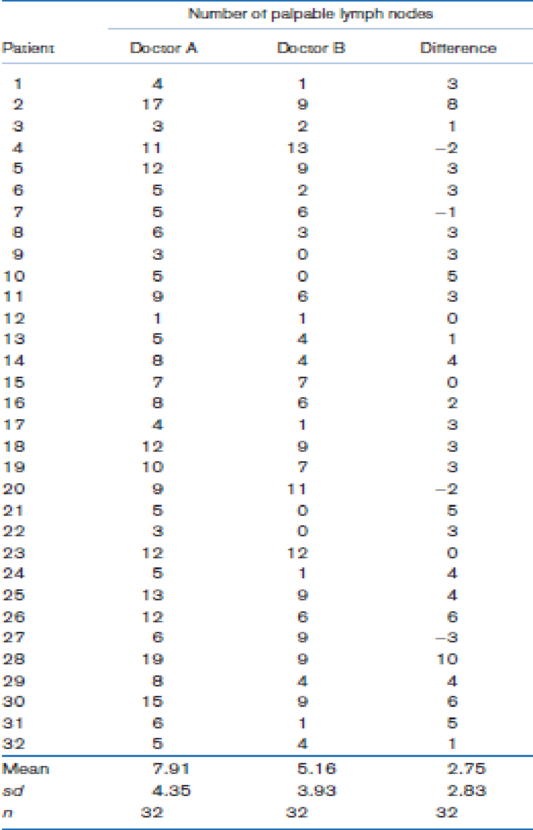
Perform the test in Problem 8.40, and report a p-value.
Want to see the full answer?
Check out a sample textbook solutionChapter 8 Solutions
Fundamentals of Biostatistics
- The authors of the paper "Statistical Methods for Assessing Agreement Between Two Methods of Clinical Measurement"† compared two different instruments for measuring a person's ability to breathe out air. (This measurement is helpful in diagnosing various lung disorders.) The two instruments considered were a Wright peak flow meter and a mini-Wright peak flow meter. Seventeen people participated in the study, and for each person air flow was measured once using the Wright meter and once using the mini-Wright meter. Subject Mini-WrightMeter WrightMeter Subject Mini-WrightMeter WrightMeter 1 512 494 10 445 433 2 430 395 11 432 417 3 520 516 12 626 656 4 428 434 13 260 267 5 500 476 14 477 478 6 600 557 15 259 178 7 364 413 16 350 423 8 380 442 17 451 427 9 658 650 (a) Suppose that the Wright meter is considered to provide a better measure of air flow, but the mini-Wright meter is easier to transport and to use. If the two types of meters produce different…arrow_forwardThe authors of the paper "Statistical Methods for Assessing Agreement Between Two Methods of Clinical Measurement"† compared two different instruments for measuring a person's ability to breathe out air. (This measurement is helpful in diagnosing various lung disorders.) The two instruments considered were a Wright peak flow meter and a mini-Wright peak flow meter. Seventeen people participated in the study, and for each person air flow was measured once using the Wright meter and once using the mini-Wright meter. Subject Mini-WrightMeter WrightMeter Subject Mini-WrightMeter WrightMeter 1 512 494 10 445 433 2 430 395 11 432 417 3 520 516 12 626 656 4 428 434 13 260 267 5 500 476 14 477 478 6 600 557 15 259 178 7 364 413 16 350 423 8 380 442 17 451 427 9 658 650 (a) Suppose that the Wright meter is considered to provide a better measure of air flow, but the mini-Wright meter is easier to transport and to use. If the two types of meters produce…arrow_forwardThe authors of the paper "Statistical Methods for Assessing Agreement Between Two Methods of Clinical Measurement" compared two different instruments for measuring a subject's ability to breathe out air.+ (This measurement is helpful in diagnosing various lung disorders.) The two instruments considered were a Wright peak flow meter and a mini-Wright peak flow meter. Seventeen subjects participated in the study, and for each subject air flow was measured once using the Wright meter and once using the mini-Wright meter. Mini- Subject Wright Meter 1 2 3 4 5 6 7 8 9 512 430 520 428 500 600 364 380 658 Wright Meter 494 395 516 434 476 557 413 442 650 Subject 10 11 12 13 14 15 16 17 Mini- Wright Meter 445 432 626 260 477 259 350 451 Wright Meter 433 417 656 267 478 178 423 427 (a) Suppose that the Wright meter is considered to provide a better measure of air flow, but the mini-Wright meter is easier to transport and to use. If the two types of meters produce different readings but there is a…arrow_forward
- A data set from a study that examined the effect of a specific diet on blood pressure is provided . Participants (n = 72) were randomly assigned either to a group that was put on the diet (Diet = Present) or to a group that was not put on the diet (Diet = Absent), and researchers wanted to know whether the diet had a significant impact on blood pressure. Fully interpret the results in the context of this study (i.e., report the conclusions as related to the research question).arrow_forwardThe article “Arsenic and Mercury in Lake Whitefish and Burbot Near the Abandoned Giant Mine on Great Slave Lake” (P. Cott, B. Zajdlik, et al., Journal of Great Lakes Research, 2016:223–232) presents measurements of arsenic concentrations in fish found in Northern Canada. In a sample of 8 whitefish caught in Yellowknife Bay, the mean arsenic concentration in the liver was 0.32 mg/kg, with a standard deviation of 0.05 mg/kg. Can you conclude that the mean arsenic concentration in whitefish in Yellowknife Bay is greater than 0.3 mg/kg?arrow_forwardA Canadian study measuring depression level in teens (as reported in the Journal of Adolescence, vol. 25, 2002) randomly sampled 112 male teens and 101 female teens, and scored them on a common depression scale (higher score representing more depression). The researchers suspected that the mean depression score for male teens is higher than for female teens, and wanted to check whether data would support this hypothesis. If μ1 and μ2 represent the mean depression score for male teens and female teens respectively, which of the following is an appropriate pair of hypotheses in this case? Check all that apply.arrow_forward
- The death rate per 100,000 for lung cancer is 7 among non-smokers and 71 among smokers. The death rate per 100,000 for coronary thrombosis is 422 among non-smokers and 599 among smokers. The prevalence of smoking in the population is 55%. The relative risk of dying for a smoker compared to a non-smoker is: [Refer to the chapter titled “Study Designs: Cohort Studies”] A. 9.1 for lung cancer and 0.30 for coronary thrombosis. B. 10.1 for lung cancer and 1.4 for coronary thrombosis. C. 10.1 for lung cancer and 8.4 for coronary thrombosis. D. 9.1 for lung cancer and 1.4 for coronary thrombosis. E. 12.4 for lung cancer and 1.7 for coronary thrombosis.arrow_forwardThe article “Arsenic and Mercury in Lake Whitefish and Burbot Near the Abandoned Giant Mine on Great Slave Lake” (P. Cott, B. Zajdlik, et al., Journal of Great Lakes Research, 2016:223–232) presents measurements of arsenic concentrations in fish found in Northern Canada. a) In a sample of 8 whitefish caught in Yellowknife Bay, the mean arsenic concentration in the liver was 0.32 mg/kg, with a standard deviation of 0.05 mg/kg. Find a 95% confidence interval for the concentration in whitefish found in Yellowknife Bay. b) In a sample of 8 whitefish caught in Baker Pond, the mean arsenic concentration in the liver was 0.55 mg/kg, with a standard deviation of 0.36 mg/kg. Should the Student’s t distribution be used to find a 95% confidence interval for the concentration in whitefish found in Baker Pond? If so, find the confidence interval. If not, explain why not.arrow_forwardPatients suffering from rheumatic diseases or osteoporosis often suffer critical losses in bone mineral density (BMD). Alendronate is one medication prescribed to build or prevent further loss of BMD. Holcomb and Rothenberg (A-3) looked at 96 women taking alendronate to determine if a difference existed in the mean percent change in BMD among five different primary diagnosis classifications. Group 1 patients were diagnosed with rheumatoid arthritis (RA). Group 2 patients were a mixed collection of patients with diseases including lupus, Wegener’s granulomatosis and polyarteritis, and other vasculitic diseases (LUPUS). Group 3 patients had polymyalgia rheumatica or temporal arthritis (PMRTA). Group 4 patients had osteoarthritis (OA) and group 5 patients had osteoporosis (O) with no other rheumatic diseases identified in the medical record. Changes in BMD are shown in the following table. Discuss the Alendronate medication data in terms of variability. To determine if a difference…arrow_forward
- Patients suffering from rheumatic diseases or osteoporosis often suffer critical losses in bone mineral density (BMD). Alendronate is one medication prescribed to build or prevent further loss of BMD. Holcomb and Rothenberg (A-3) looked at 96 women taking alendronate to determine if a difference existed in the mean percent change in BMD among five different primary diagnosis classifications. Group 1 patients were diagnosed with rheumatoid arthritis (RA). Group 2 patients were a mixed collection of patients with diseases including lupus, Wegener’s granulomatosis and polyarteritis, and other vasculitic diseases (LUPUS). Group 3 patients had polymyalgia rheumatica or temporal arthritis (PMRTA). Group 4 patients had osteoarthritis (OA) and group 5 patients had osteoporosis (O) with no other rheumatic diseases identified in the medical record. Changes in BMD are shown in the following table. (TABLE IS IN THE IMAGES) a. Formulate research question b. State the null hypothesis in narrative…arrow_forwardTo help assess the health risks of second-hand smoke, the levels of cotinine (a metabolite of nicotine) were measured in mmol/l in the urine of seven subjects prior to exposure to second-hand smoke and shortly after a two-hour exposure to secondary cigarette smoke. Did the exposure significantly increase the cotinine level? Assume cotinine levels are not normally distributed and analyze with an appropriate sign test. ... Cotinine Levels (mmol/1) Subject Before After 13 19 2 17 23 3 10 19 4 21 25 15 20 6. 15 7. 32 60arrow_forwardPassive exposure to environmental tobacco smoke has been associated with growth suppression and an increased frequency of respiratory tract infections in normal children. Is this association more pronounced in children with cystic fibrosis? To answer this question, 43 children (18 girls and 25 boys) attending a 2-week summer camp for cystic fibrosis patients were studied (New England Journal of Medicine, Sept. 20, 1990). Among several variables measured were the child's weight percentile (y) and the number of cigarettes smoked per day in the child's home (x). a. For the 18 girls, the coefficient of correlation between y and x was reported as r = –.50. Interpret - this result. b. Refer to part a. The p-value for testing Ho: p = 0 against H;: p # 0 was reported as p = .03. n Interpret this result. c. For the 25 boys, the coefficient of correlation between y and x was reported asr = -.12. Interpret %3D %3D this result. d. Refer to part c. The p-value for testing Ho: p = 0 against Ha: p #…arrow_forward
- Glencoe Algebra 1, Student Edition, 9780079039897...AlgebraISBN:9780079039897Author:CarterPublisher:McGraw Hill