
Concept explainers
Videos
The EPIC-Norfolk study, a study of diet and cancer in Great Britain, was performed to assess the relationship between dietary intake of vitamin C, plasma levels of vitamin C (in blood), and other predictors. One hypothesis is that smokers might have different vitamin C intake and vitamin C plasma levels than nonsmokers. Dietary intake of vitamin C was obtained using 7-day diet records in which a subject recorded what he or she ate in real time and a computer program was used to estimate nutrient intake based on the diet record data. The data in Table 8.40 were obtained for current smokers and nonsmokers.
Table 8.40 Association between current smoking and diet record intake of vitamin C in the EPIC-Norfolk Studya
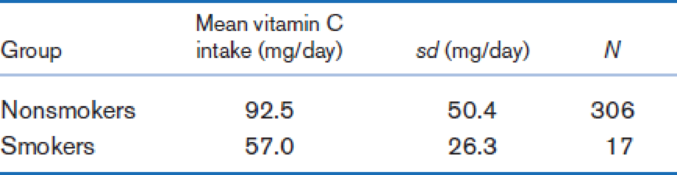
aDiet record intake includes intake from foods but not from vitamin supplements.
Perform the test in Problem 8.168, and identify whether there is a significant difference between the two variances (i.e., is p < .05 or p > .05?).
8.168 What test can be used to compare the standard deviation of diet record vitamin C intake between current smokers vs. nonsmokers?
Want to see the full answer?
Check out a sample textbook solution
Chapter 8 Solutions
Fundamentals of Biostatistics


- A company found that the daily sales revenue of its flagship product follows a normal distribution with a mean of $4500 and a standard deviation of $450. The company defines a "high-sales day" that is, any day with sales exceeding $4800. please provide a step by step on how to get the answers in excel Q: What percentage of days can the company expect to have "high-sales days" or sales greater than $4800? Q: What is the sales revenue threshold for the bottom 10% of days? (please note that 10% refers to the probability/area under bell curve towards the lower tail of bell curve) Provide answers in the yellow cellsarrow_forwardFind the critical value for a left-tailed test using the F distribution with a 0.025, degrees of freedom in the numerator=12, and degrees of freedom in the denominator = 50. A portion of the table of critical values of the F-distribution is provided. Click the icon to view the partial table of critical values of the F-distribution. What is the critical value? (Round to two decimal places as needed.)arrow_forwardA retail store manager claims that the average daily sales of the store are $1,500. You aim to test whether the actual average daily sales differ significantly from this claimed value. You can provide your answer by inserting a text box and the answer must include: Null hypothesis, Alternative hypothesis, Show answer (output table/summary table), and Conclusion based on the P value. Showing the calculation is a must. If calculation is missing,so please provide a step by step on the answers Numerical answers in the yellow cellsarrow_forward
 Glencoe Algebra 1, Student Edition, 9780079039897...AlgebraISBN:9780079039897Author:CarterPublisher:McGraw Hill
 Big Ideas Math A Bridge To Success Algebra 1: Stu...AlgebraISBN:9781680331141Author:HOUGHTON MIFFLIN HARCOURTPublisher:Houghton Mifflin Harcourt
 Linear Algebra: A Modern IntroductionAlgebraISBN:9781285463247Author:David PoolePublisher:Cengage Learning