
Videos
A study is being planned to assess whether a topical antiallergic eye drop is effective in preventing the signs and symptoms of allergic conjunctivitis. In a pilot study, at an initial visit, participants are given an allergen challenge; that is, they are subjected to a substance that provokes allergy signs (e.g., cat dander) and their redness score is noted 10 minutes after the allergen challenge (visit 1 score). At a follow-up visit, the same procedure is followed, except that participants are given an active eye drop in one eye and the placebo in the fellow eye 3 hours before the challenge; a visit 2 score is obtained 10 minutes after the challenge. The data collected are shown in Table 8.26.
Table 8.26 Effect of an eye drop in reducing ocular redness among participants subjected to an allergen challenge
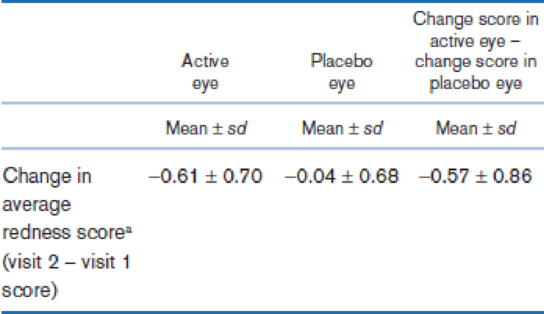
aThe redness score
Suppose we want to estimate the number of participants needed in the main study so that there is a 90% chance of finding a significant difference between active and placebo eyes using a two-sided test with a significance level of .05. We expect the active eyes to have a mean redness score 0.5 unit less than that of the placebo eyes. How many participants are needed in the main study?
Want to see the full answer?
Check out a sample textbook solution
Chapter 8 Solutions
Fundamentals of Biostatistics


- Find the critical value for a left-tailed test using the F distribution with a 0.025, degrees of freedom in the numerator=12, and degrees of freedom in the denominator = 50. A portion of the table of critical values of the F-distribution is provided. Click the icon to view the partial table of critical values of the F-distribution. What is the critical value? (Round to two decimal places as needed.)arrow_forwardA retail store manager claims that the average daily sales of the store are $1,500. You aim to test whether the actual average daily sales differ significantly from this claimed value. You can provide your answer by inserting a text box and the answer must include: Null hypothesis, Alternative hypothesis, Show answer (output table/summary table), and Conclusion based on the P value. Showing the calculation is a must. If calculation is missing,so please provide a step by step on the answers Numerical answers in the yellow cellsarrow_forwardShow all workarrow_forward
- Show all workarrow_forwardplease find the answers for the yellows boxes using the information and the picture belowarrow_forwardA marketing agency wants to determine whether different advertising platforms generate significantly different levels of customer engagement. The agency measures the average number of daily clicks on ads for three platforms: Social Media, Search Engines, and Email Campaigns. The agency collects data on daily clicks for each platform over a 10-day period and wants to test whether there is a statistically significant difference in the mean number of daily clicks among these platforms. Conduct ANOVA test. You can provide your answer by inserting a text box and the answer must include: also please provide a step by on getting the answers in excel Null hypothesis, Alternative hypothesis, Show answer (output table/summary table), and Conclusion based on the P value.arrow_forward
 Glencoe Algebra 1, Student Edition, 9780079039897...AlgebraISBN:9780079039897Author:CarterPublisher:McGraw Hill
 Big Ideas Math A Bridge To Success Algebra 1: Stu...AlgebraISBN:9781680331141Author:HOUGHTON MIFFLIN HARCOURTPublisher:Houghton Mifflin Harcourt