
Intro STATS, Books a la Carte Plus New Mystatlab with Pearson Etext -- Access Card Package
4th Edition
ISBN: 9780321869852
Author: Richard D. De Veaux
Publisher: PEARSON
expand_more
expand_more
format_list_bulleted
Concept explainers
Videos
Textbook Question
Chapter 8, Problem 34E
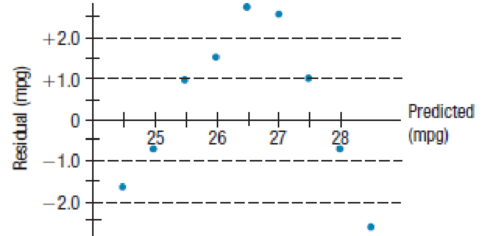
Speed How does the speed at which you drive affect your fuel economy? To find out, researchers drove a compact car for 200 miles at speeds
- a) Interpret the slope of this line in context.
- b) Explain why it’s silly to attach any meaning to the y-intercept.
- c) When this model predicts high Fuel Efficiency, what can you say about those predictions?
- d) What Fuel Efficiency does the model predict when the car is driven at 50 mph?
- e) What was the actual Fuel Efficiency when the car was driven at 45 mph?
- f) Do you think there appears to be a strong association between Speed and Fuel Efficiency? Explain.
- g) Do you think this is the appropriate model for that association? Explain.
Expert Solution & Answer
Want to see the full answer?
Check out a sample textbook solution
Students have asked these similar questions
During busy political seasons, many opinion polls are conducted. In apresidential race, how do you think the participants in polls are generally selected?Discuss any issues regarding simple random, stratified, systematic, cluster, andconvenience sampling in these polls. What about other types of polls, besides political?
Please could you explain why 0.5 was added to each upper limpit of the intervals.Thanks
28. (a) Under what conditions do we say that two random variables X and Y are
independent?
(b) Demonstrate that if X and Y are independent, then it follows that E(XY) =
E(X)E(Y);
(e) Show by a counter example that the converse of (ii) is not necessarily true.
Chapter 8 Solutions
Intro STATS, Books a la Carte Plus New Mystatlab with Pearson Etext -- Access Card Package
Ch. 8.3 - Each of these scatterplots shows an unusual point....Ch. 8.3 - Prob. 2JCCh. 8.3 - Prob. 3JCCh. 8 - Credit card spending An analysis of spending by a...Ch. 8 - Prob. 2ECh. 8 - Prob. 3ECh. 8 - Prob. 4ECh. 8 - Prob. 5ECh. 8 - Prob. 6ECh. 8 - Prob. 7E
Ch. 8 - Prob. 8ECh. 8 - Prob. 9ECh. 8 - Prob. 10ECh. 8 - Skinned knees There is a strong correlation...Ch. 8 - Prob. 12ECh. 8 - Prob. 13ECh. 8 - Average GPA An athletic director proudly states...Ch. 8 - Prob. 15ECh. 8 - Prob. 16ECh. 8 - Good model? In justifying his choice of a model, a...Ch. 8 - Prob. 20ECh. 8 - Movie dramas Heres a scatterplot of the production...Ch. 8 - Prob. 22ECh. 8 - Prob. 23ECh. 8 - Prob. 24ECh. 8 - Unusual points Each of these four scatterplots...Ch. 8 - More unusual points Each of the following...Ch. 8 - Prob. 27ECh. 8 - Prob. 28ECh. 8 - Prob. 29ECh. 8 - Whats the effect? A researcher studying violent...Ch. 8 - Reading To measure progress in reading ability,...Ch. 8 - Prob. 32ECh. 8 - Heating After keeping track of his heating...Ch. 8 - Speed How does the speed at which you drive affect...Ch. 8 - Prob. 35ECh. 8 - Prob. 36ECh. 8 - Prob. 37ECh. 8 - Prob. 38ECh. 8 - Prob. 39ECh. 8 - Prob. 40ECh. 8 - Prob. 41ECh. 8 - Prob. 42ECh. 8 - 43. Marriage age 2010 revisited Suppose you wanted...Ch. 8 - Prob. 44ECh. 8 - Prob. 45ECh. 8 - Prob. 46ECh. 8 - Prob. 47ECh. 8 - Prob. 48E
Knowledge Booster


Learn more about
Need a deep-dive on the concept behind this application? Look no further. Learn more about this topic, statistics and related others by exploring similar questions and additional content below.Similar questions
- 19. Let X be a non-negative random variable. Show that lim nE (IX >n)) = 0. E lim (x)-0. = >arrow_forward(c) Utilize Fubini's Theorem to demonstrate that E(X)= = (1- F(x))dx.arrow_forward(c) Describe the positive and negative parts of a random variable. How is the integral defined for a general random variable using these components?arrow_forward
- 26. (a) Provide an example where X, X but E(X,) does not converge to E(X).arrow_forward(b) Demonstrate that if X and Y are independent, then it follows that E(XY) E(X)E(Y);arrow_forward(d) Under what conditions do we say that a random variable X is integrable, specifically when (i) X is a non-negative random variable and (ii) when X is a general random variable?arrow_forward
arrow_back_ios
SEE MORE QUESTIONS
arrow_forward_ios
Recommended textbooks for you
 Glencoe Algebra 1, Student Edition, 9780079039897...AlgebraISBN:9780079039897Author:CarterPublisher:McGraw Hill
 Elementary AlgebraAlgebraISBN:9780998625713Author:Lynn Marecek, MaryAnne Anthony-SmithPublisher:OpenStax - Rice University


 Holt Mcdougal Larson Pre-algebra: Student Edition...AlgebraISBN:9780547587776Author:HOLT MCDOUGALPublisher:HOLT MCDOUGAL
Glencoe Algebra 1, Student Edition, 9780079039897...
Algebra
ISBN:9780079039897
Author:Carter
Publisher:McGraw Hill
Elementary Algebra
Algebra
ISBN:9780998625713
Author:Lynn Marecek, MaryAnne Anthony-Smith
Publisher:OpenStax - Rice University
Holt Mcdougal Larson Pre-algebra: Student Edition...
Algebra
ISBN:9780547587776
Author:HOLT MCDOUGAL
Publisher:HOLT MCDOUGAL
Points, Lines, Planes, Segments, & Rays - Collinear vs Coplanar Points - Geometry; Author: The Organic Chemistry Tutor;https://www.youtube.com/watch?v=dDWjhRfBsKM;License: Standard YouTube License, CC-BY
Naming Points, Lines, and Planes; Author: Florida PASS Program;https://www.youtube.com/watch?v=F-LxiLSSaLg;License: Standard YouTube License, CC-BY