
Intro STATS, Books a la Carte Plus New Mystatlab with Pearson Etext -- Access Card Package
4th Edition
ISBN: 9780321869852
Author: Richard D. De Veaux
Publisher: PEARSON
expand_more
expand_more
format_list_bulleted
Concept explainers
Videos
Textbook Question
Chapter 8, Problem 26E
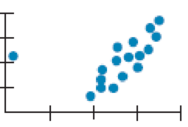
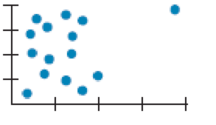
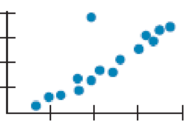
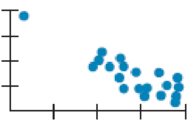
More unusual points Each of the following
- 1) In what way is the point unusual? Does it have high leverage, a large residual, or both?
- 2) Do you think that point is an influential point?
- 3) If that point were removed, would the
correlation become stronger or weaker? Explain. - 4) If that point were removed, would the slope of the regression line increase or decrease? Explain.
Expert Solution & Answer
Want to see the full answer?
Check out a sample textbook solution
Students have asked these similar questions
The following data represent total ventilation measured in liters of air per minute per square meter of body area for two independent (and randomly chosen) samples.
Analyze these data using the appropriate non-parametric hypothesis test
each column represents before & after measurements on the same individual. Analyze with the appropriate non-parametric hypothesis test for a paired design.
Should you be confident in applying your regression equation to estimate the heart rate of a python at 35°C? Why or why not?
Chapter 8 Solutions
Intro STATS, Books a la Carte Plus New Mystatlab with Pearson Etext -- Access Card Package
Ch. 8.3 - Each of these scatterplots shows an unusual point....Ch. 8.3 - Prob. 2JCCh. 8.3 - Prob. 3JCCh. 8 - Credit card spending An analysis of spending by a...Ch. 8 - Prob. 2ECh. 8 - Prob. 3ECh. 8 - Prob. 4ECh. 8 - Prob. 5ECh. 8 - Prob. 6ECh. 8 - Prob. 7E
Ch. 8 - Prob. 8ECh. 8 - Prob. 9ECh. 8 - Prob. 10ECh. 8 - Skinned knees There is a strong correlation...Ch. 8 - Prob. 12ECh. 8 - Prob. 13ECh. 8 - Average GPA An athletic director proudly states...Ch. 8 - Prob. 15ECh. 8 - Prob. 16ECh. 8 - Good model? In justifying his choice of a model, a...Ch. 8 - Prob. 20ECh. 8 - Movie dramas Heres a scatterplot of the production...Ch. 8 - Prob. 22ECh. 8 - Prob. 23ECh. 8 - Prob. 24ECh. 8 - Unusual points Each of these four scatterplots...Ch. 8 - More unusual points Each of the following...Ch. 8 - Prob. 27ECh. 8 - Prob. 28ECh. 8 - Prob. 29ECh. 8 - Whats the effect? A researcher studying violent...Ch. 8 - Reading To measure progress in reading ability,...Ch. 8 - Prob. 32ECh. 8 - Heating After keeping track of his heating...Ch. 8 - Speed How does the speed at which you drive affect...Ch. 8 - Prob. 35ECh. 8 - Prob. 36ECh. 8 - Prob. 37ECh. 8 - Prob. 38ECh. 8 - Prob. 39ECh. 8 - Prob. 40ECh. 8 - Prob. 41ECh. 8 - Prob. 42ECh. 8 - 43. Marriage age 2010 revisited Suppose you wanted...Ch. 8 - Prob. 44ECh. 8 - Prob. 45ECh. 8 - Prob. 46ECh. 8 - Prob. 47ECh. 8 - Prob. 48E
Knowledge Booster


Learn more about
Need a deep-dive on the concept behind this application? Look no further. Learn more about this topic, statistics and related others by exploring similar questions and additional content below.Similar questions
- Given your fitted regression line, what would be the residual for snake #5 (10 C)?arrow_forwardCalculate the 95% confidence interval around your estimate of r using Fisher’s z-transformation. In your final answer, make sure to back-transform to the original units.arrow_forwardCalculate Pearson’s correlation coefficient (r) between temperature and heart rate.arrow_forward
- A researcher wishes to estimate, with 90% confidence, the population proportion of adults who support labeling legislation for genetically modified organisms (GMOs). Her estimate must be accurate within 4% of the true proportion. (a) No preliminary estimate is available. Find the minimum sample size needed. (b) Find the minimum sample size needed, using a prior study that found that 65% of the respondents said they support labeling legislation for GMOs. (c) Compare the results from parts (a) and (b). ... (a) What is the minimum sample size needed assuming that no prior information is available? n = (Round up to the nearest whole number as needed.)arrow_forwardThe table available below shows the costs per mile (in cents) for a sample of automobiles. At a = 0.05, can you conclude that at least one mean cost per mile is different from the others? Click on the icon to view the data table. Let Hss, HMS, HLS, Hsuv and Hмy represent the mean costs per mile for small sedans, medium sedans, large sedans, SUV 4WDs, and minivans respectively. What are the hypotheses for this test? OA. Ho: Not all the means are equal. Ha Hss HMS HLS HSUV HMV B. Ho Hss HMS HLS HSUV = μMV Ha: Hss *HMS *HLS*HSUV * HMV C. Ho Hss HMS HLS HSUV =μMV = = H: Not all the means are equal. D. Ho Hss HMS HLS HSUV HMV Ha Hss HMS HLS =HSUV = HMVarrow_forwardQuestion: A company launches two different marketing campaigns to promote the same product in two different regions. After one month, the company collects the sales data (in units sold) from both regions to compare the effectiveness of the campaigns. The company wants to determine whether there is a significant difference in the mean sales between the two regions. Perform a two sample T-test You can provide your answer by inserting a text box and the answer must include: Null hypothesis, Alternative hypothesis, Show answer (output table/summary table), and Conclusion based on the P value. (2 points = 0.5 x 4 Answers) Each of these is worth 0.5 points. However, showing the calculation is must. If calculation is missing, the whole answer won't get any credit.arrow_forward
arrow_back_ios
SEE MORE QUESTIONS
arrow_forward_ios
Recommended textbooks for you
 Big Ideas Math A Bridge To Success Algebra 1: Stu...AlgebraISBN:9781680331141Author:HOUGHTON MIFFLIN HARCOURTPublisher:Houghton Mifflin Harcourt
 Glencoe Algebra 1, Student Edition, 9780079039897...AlgebraISBN:9780079039897Author:CarterPublisher:McGraw Hill
 Functions and Change: A Modeling Approach to Coll...AlgebraISBN:9781337111348Author:Bruce Crauder, Benny Evans, Alan NoellPublisher:Cengage Learning
 Algebra and Trigonometry (MindTap Course List)AlgebraISBN:9781305071742Author:James Stewart, Lothar Redlin, Saleem WatsonPublisher:Cengage Learning
 College AlgebraAlgebraISBN:9781305115545Author:James Stewart, Lothar Redlin, Saleem WatsonPublisher:Cengage Learning
 Holt Mcdougal Larson Pre-algebra: Student Edition...AlgebraISBN:9780547587776Author:HOLT MCDOUGALPublisher:HOLT MCDOUGAL
Big Ideas Math A Bridge To Success Algebra 1: Stu...
Algebra
ISBN:9781680331141
Author:HOUGHTON MIFFLIN HARCOURT
Publisher:Houghton Mifflin Harcourt
Glencoe Algebra 1, Student Edition, 9780079039897...
Algebra
ISBN:9780079039897
Author:Carter
Publisher:McGraw Hill
Functions and Change: A Modeling Approach to Coll...
Algebra
ISBN:9781337111348
Author:Bruce Crauder, Benny Evans, Alan Noell
Publisher:Cengage Learning
Algebra and Trigonometry (MindTap Course List)
Algebra
ISBN:9781305071742
Author:James Stewart, Lothar Redlin, Saleem Watson
Publisher:Cengage Learning
College Algebra
Algebra
ISBN:9781305115545
Author:James Stewart, Lothar Redlin, Saleem Watson
Publisher:Cengage Learning
Holt Mcdougal Larson Pre-algebra: Student Edition...
Algebra
ISBN:9780547587776
Author:HOLT MCDOUGAL
Publisher:HOLT MCDOUGAL
Correlation Vs Regression: Difference Between them with definition & Comparison Chart; Author: Key Differences;https://www.youtube.com/watch?v=Ou2QGSJVd0U;License: Standard YouTube License, CC-BY
Correlation and Regression: Concepts with Illustrative examples; Author: LEARN & APPLY : Lean and Six Sigma;https://www.youtube.com/watch?v=xTpHD5WLuoA;License: Standard YouTube License, CC-BY