
Concept explainers
Videos
Credit card spending An analysis of spending by a sample of credit card bank cardholders shows that spending by cardholders in January (Jan) is related to their spending in December (Dec):
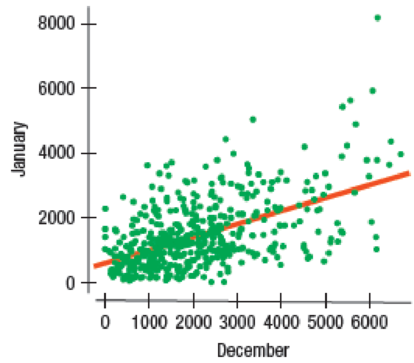
The assumptions and conditions of the linear regression seemed to be satisfied and an analyst was about to predict January spending using the model
Another analyst worried that different types of cardholders might behave differently. She examined the spending patterns of the cardholders and placed them into five market Segments. When she plotted the data using different colors and symbols for the five different segments, she found the following:
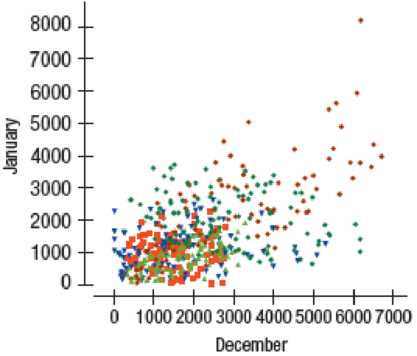
Look at this plot carefully and discuss why she might be worried about the predictions from the model
Being worried to make a prediction from the model
Explanation of Solution
Given info:
A scatterplot of spending for a sample of credit card bank cardholders in January and in December is given. The corresponding regression model to predict January spending from December spending is
Another scatterplot of spending for a sample of credit card bank cardholders in January and that in December for five market segments is given.
Justification:
The conditions for a scatterplot that is well-fitted for the data is as follows:
- Straight enough condition: The relationship between y and x is straight enough to proceed with a linear regression model.
- Outlier condition: No outlier must be there which influences the fit of the least square line.
- Thickness condition: The spread of the data around the generally straight relationship seems to be consistent for all values of x.
The different segments are not scattered at random throughout the scatterplot.
Thus, the spread of the data is not consistent for all values of December and each segment may have a different relationship that might affect the accuracy of the model to predict.
The relationship between the spending of credit card bank cardholders in January and in December is not straight enough to proceed with a linear regression model.
Want to see more full solutions like this?
Chapter 8 Solutions
Intro STATS, Books a la Carte Plus New Mystatlab with Pearson Etext -- Access Card Package


- Find the critical value for a left-tailed test using the F distribution with a 0.025, degrees of freedom in the numerator=12, and degrees of freedom in the denominator = 50. A portion of the table of critical values of the F-distribution is provided. Click the icon to view the partial table of critical values of the F-distribution. What is the critical value? (Round to two decimal places as needed.)arrow_forwardA retail store manager claims that the average daily sales of the store are $1,500. You aim to test whether the actual average daily sales differ significantly from this claimed value. You can provide your answer by inserting a text box and the answer must include: Null hypothesis, Alternative hypothesis, Show answer (output table/summary table), and Conclusion based on the P value. Showing the calculation is a must. If calculation is missing,so please provide a step by step on the answers Numerical answers in the yellow cellsarrow_forwardShow all workarrow_forward
- Show all workarrow_forwardplease find the answers for the yellows boxes using the information and the picture belowarrow_forwardA marketing agency wants to determine whether different advertising platforms generate significantly different levels of customer engagement. The agency measures the average number of daily clicks on ads for three platforms: Social Media, Search Engines, and Email Campaigns. The agency collects data on daily clicks for each platform over a 10-day period and wants to test whether there is a statistically significant difference in the mean number of daily clicks among these platforms. Conduct ANOVA test. You can provide your answer by inserting a text box and the answer must include: also please provide a step by on getting the answers in excel Null hypothesis, Alternative hypothesis, Show answer (output table/summary table), and Conclusion based on the P value.arrow_forward
 Big Ideas Math A Bridge To Success Algebra 1: Stu...AlgebraISBN:9781680331141Author:HOUGHTON MIFFLIN HARCOURTPublisher:Houghton Mifflin Harcourt
 Glencoe Algebra 1, Student Edition, 9780079039897...AlgebraISBN:9780079039897Author:CarterPublisher:McGraw Hill
 College AlgebraAlgebraISBN:9781305115545Author:James Stewart, Lothar Redlin, Saleem WatsonPublisher:Cengage Learning
 Functions and Change: A Modeling Approach to Coll...AlgebraISBN:9781337111348Author:Bruce Crauder, Benny Evans, Alan NoellPublisher:Cengage Learning
 Algebra and Trigonometry (MindTap Course List)AlgebraISBN:9781305071742Author:James Stewart, Lothar Redlin, Saleem WatsonPublisher:Cengage Learning