
Intro STATS, Books a la Carte Plus New Mystatlab with Pearson Etext -- Access Card Package
4th Edition
ISBN: 9780321869852
Author: Richard D. De Veaux
Publisher: PEARSON
expand_more
expand_more
format_list_bulleted
Concept explainers
Videos
Textbook Question
Chapter 8, Problem 33E
Heating After keeping track of his heating expenses for several winters, a homeowner believes he can estimate the monthly cost from the average daily Fahrenheit temperature by using the model
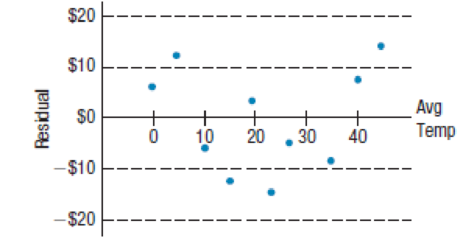
- a) Interpret the slope of the line in this context.
- b) Interpret the y-intercept of the line in this context.
- c) During months when the temperature stays around freezing, would you expect cost predictions based on this model to be accurate, too low, or too high? Explain.
- d) What heating cost does the model predict for a month that averages 10°?
- e) During one of the months on which the model was based, the temperature did average 10°. What were the actual heating costs for that month?
- f) Should the homeowner use this model? Explain.
- g) Would this model be more successful if the temperature were expressed in degrees Celsius? Explain.
Expert Solution & Answer
Want to see the full answer?
Check out a sample textbook solution
Students have asked these similar questions
Please could you explain why 0.5 was added to each upper limpit of the intervals.Thanks
28. (a) Under what conditions do we say that two random variables X and Y are
independent?
(b) Demonstrate that if X and Y are independent, then it follows that E(XY) =
E(X)E(Y);
(e) Show by a counter example that the converse of (ii) is not necessarily true.
1. Let X and Y be random variables and suppose that A = F. Prove that
Z XI(A)+YI(A) is a random variable.
Chapter 8 Solutions
Intro STATS, Books a la Carte Plus New Mystatlab with Pearson Etext -- Access Card Package
Ch. 8.3 - Each of these scatterplots shows an unusual point....Ch. 8.3 - Prob. 2JCCh. 8.3 - Prob. 3JCCh. 8 - Credit card spending An analysis of spending by a...Ch. 8 - Prob. 2ECh. 8 - Prob. 3ECh. 8 - Prob. 4ECh. 8 - Prob. 5ECh. 8 - Prob. 6ECh. 8 - Prob. 7E
Ch. 8 - Prob. 8ECh. 8 - Prob. 9ECh. 8 - Prob. 10ECh. 8 - Skinned knees There is a strong correlation...Ch. 8 - Prob. 12ECh. 8 - Prob. 13ECh. 8 - Average GPA An athletic director proudly states...Ch. 8 - Prob. 15ECh. 8 - Prob. 16ECh. 8 - Good model? In justifying his choice of a model, a...Ch. 8 - Prob. 20ECh. 8 - Movie dramas Heres a scatterplot of the production...Ch. 8 - Prob. 22ECh. 8 - Prob. 23ECh. 8 - Prob. 24ECh. 8 - Unusual points Each of these four scatterplots...Ch. 8 - More unusual points Each of the following...Ch. 8 - Prob. 27ECh. 8 - Prob. 28ECh. 8 - Prob. 29ECh. 8 - Whats the effect? A researcher studying violent...Ch. 8 - Reading To measure progress in reading ability,...Ch. 8 - Prob. 32ECh. 8 - Heating After keeping track of his heating...Ch. 8 - Speed How does the speed at which you drive affect...Ch. 8 - Prob. 35ECh. 8 - Prob. 36ECh. 8 - Prob. 37ECh. 8 - Prob. 38ECh. 8 - Prob. 39ECh. 8 - Prob. 40ECh. 8 - Prob. 41ECh. 8 - Prob. 42ECh. 8 - 43. Marriage age 2010 revisited Suppose you wanted...Ch. 8 - Prob. 44ECh. 8 - Prob. 45ECh. 8 - Prob. 46ECh. 8 - Prob. 47ECh. 8 - Prob. 48E
Knowledge Booster


Learn more about
Need a deep-dive on the concept behind this application? Look no further. Learn more about this topic, statistics and related others by exploring similar questions and additional content below.Similar questions
- (c) Utilize Fubini's Theorem to demonstrate that E(X)= = (1- F(x))dx.arrow_forward(c) Describe the positive and negative parts of a random variable. How is the integral defined for a general random variable using these components?arrow_forward26. (a) Provide an example where X, X but E(X,) does not converge to E(X).arrow_forward
- (b) Demonstrate that if X and Y are independent, then it follows that E(XY) E(X)E(Y);arrow_forward(d) Under what conditions do we say that a random variable X is integrable, specifically when (i) X is a non-negative random variable and (ii) when X is a general random variable?arrow_forward29. State the Borel-Cantelli Lemmas without proof. What is the primary distinction between Lemma 1 and Lemma 2?arrow_forward
arrow_back_ios
SEE MORE QUESTIONS
arrow_forward_ios
Recommended textbooks for you
 Glencoe Algebra 1, Student Edition, 9780079039897...AlgebraISBN:9780079039897Author:CarterPublisher:McGraw Hill
 Algebra & Trigonometry with Analytic GeometryAlgebraISBN:9781133382119Author:SwokowskiPublisher:Cengage
 Algebra and Trigonometry (MindTap Course List)AlgebraISBN:9781305071742Author:James Stewart, Lothar Redlin, Saleem WatsonPublisher:Cengage Learning
 College AlgebraAlgebraISBN:9781305115545Author:James Stewart, Lothar Redlin, Saleem WatsonPublisher:Cengage Learning
 Algebra: Structure And Method, Book 1AlgebraISBN:9780395977224Author:Richard G. Brown, Mary P. Dolciani, Robert H. Sorgenfrey, William L. ColePublisher:McDougal Littell
Glencoe Algebra 1, Student Edition, 9780079039897...
Algebra
ISBN:9780079039897
Author:Carter
Publisher:McGraw Hill
Algebra & Trigonometry with Analytic Geometry
Algebra
ISBN:9781133382119
Author:Swokowski
Publisher:Cengage
Algebra and Trigonometry (MindTap Course List)
Algebra
ISBN:9781305071742
Author:James Stewart, Lothar Redlin, Saleem Watson
Publisher:Cengage Learning
College Algebra
Algebra
ISBN:9781305115545
Author:James Stewart, Lothar Redlin, Saleem Watson
Publisher:Cengage Learning
Algebra: Structure And Method, Book 1
Algebra
ISBN:9780395977224
Author:Richard G. Brown, Mary P. Dolciani, Robert H. Sorgenfrey, William L. Cole
Publisher:McDougal Littell
Correlation Vs Regression: Difference Between them with definition & Comparison Chart; Author: Key Differences;https://www.youtube.com/watch?v=Ou2QGSJVd0U;License: Standard YouTube License, CC-BY
Correlation and Regression: Concepts with Illustrative examples; Author: LEARN & APPLY : Lean and Six Sigma;https://www.youtube.com/watch?v=xTpHD5WLuoA;License: Standard YouTube License, CC-BY