
Videos
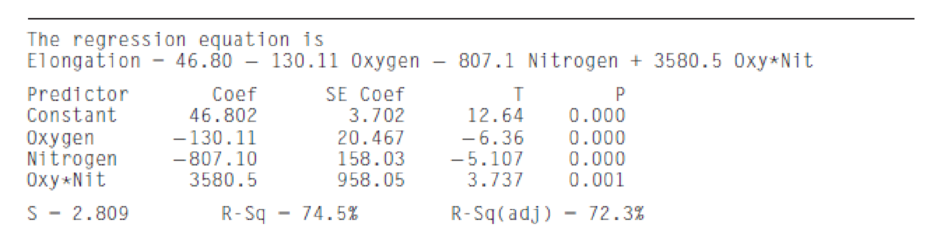
The article “Advances in Oxygen Equivalence liquations for Predicting the Properties of Titanium Welds” (D. Harwig, W. Ittiwattana, and H. Castner, The Welding Journal, 2001:126s–136s) reports an experiment to predict various properties of titanium welds. Among other properties, the elongation (in %) was measured, along with the oxygen content and nitrogen content (both in percent). The following MINITAB output presents results of fitting the model
- a. Predict the elongation for a weld with an oxygen content of 0.15% and a nitrogen content of 0.01%.
- b. If two welds both have a nitrogen content of 0.006%, and their oxygen content differs by 0.05%, what would you predict their difference in elongation to be?
- c. Two welds have identical oxygen contents, and nitrogen contents that differ by 0.005%. Is this enough information to predict their difference in elongation? If so, predict the elongation. If not, explain what additional information is needed.
a.
Find the predicted elongation percent of a weld with 0.15% of oxygen content and 0.01% of nitrogen content.
Answer to Problem 1SE
The predicted elongation percent of a weld with 0.15% of oxygen content and 0.01% of nitrogen content is likely to be 24.6%.
Explanation of Solution
Calculation:
The data represents the MINITAB output of the regression model
Multiple linear regression model:
A multiple linear regression model is given as
The ‘Coefficient’ column of the regression analysis MINITAB output gives the slopes corresponding to the respective variables stored in the column ‘Predictor’.
Let
From the accompanying MINITAB output, the intercept is
The estimates of the slopes are:
Thus, using the definition of a multiple regression model, the multiple regression equation is:
Here,
Predicted elongation percent of a weld:
Thus, the predicted elongation percent of a weld with 0.15% of oxygen content and 0.01% of nitrogen content is likely to be 24.6%.
b.
Find the change between the elongation percent of the two welds when the nitrogen content is 0.006% for both the welds with one weld containing 0.05% more oxygen content.
Answer to Problem 1SE
The elongation percent of two welds differ by –5.43% when the nitrogen content is 0.006% for both the welds with one weld containing 0.05% more oxygen content.
Explanation of Solution
Justification:
Slope in a multiple regression equation:
The slope
The multiple regression line is,
The coefficient or slope of Oxygen content in the regression model is
From this it can be said that, the value of elongation percent decreases by 130.11 for a 1% increase in Oxygen content, provided the effects of Nitrogen content is accounted for.
Here, both the welds have same Nitrogen content 0.006% and one weld has 0.05% more oxygen content than the other.
The change between the elongation percent of two welds is,
Thus, the elongation percent of two welds differ by –5.43% when the nitrogen content is 0.006% for both the welds with one weld containing 0.05% more oxygen content.
c.
Check whether it is possible to estimate the change in the elongation percent of the two welds when the nitrogen content is same for both the welds with one weld containing 0.005% more oxygen content.
If possible, predict the change.
Answer to Problem 1SE
No, it is not possible to estimate the change in the elongation percent of the two welds when the nitrogen content is same for both the welds with one weld containing 0.005% more oxygen content.
Explanation of Solution
Justification:
Slope in a multiple regression equation:
The slope
The multiple regression line is,
Here, the elongation is dependent on the nitrogen content, oxygen content and the interaction of nitrogen and oxygen content.
Hence, the coefficient of
Therefore, it is not possible to determine the change in the elongation percent only with the value of oxygen content.
Thus, it is not possible to estimate the change in the elongation percent of the two welds when the nitrogen content is same for both the welds with one weld containing 0.005% more oxygen content.
Want to see more full solutions like this?
Chapter 8 Solutions
Statistics for Engineers and Scientists
Additional Math Textbook Solutions
Elementary and Intermediate Algebra: Concepts and Applications (7th Edition)
APPLIED STAT.IN BUS.+ECONOMICS
Introductory Statistics
Calculus: Early Transcendentals (2nd Edition)
Elementary Statistics: Picturing the World (7th Edition)
Algebra and Trigonometry (6th Edition)


- Show all workarrow_forwardplease find the answers for the yellows boxes using the information and the picture belowarrow_forwardA marketing agency wants to determine whether different advertising platforms generate significantly different levels of customer engagement. The agency measures the average number of daily clicks on ads for three platforms: Social Media, Search Engines, and Email Campaigns. The agency collects data on daily clicks for each platform over a 10-day period and wants to test whether there is a statistically significant difference in the mean number of daily clicks among these platforms. Conduct ANOVA test. You can provide your answer by inserting a text box and the answer must include: also please provide a step by on getting the answers in excel Null hypothesis, Alternative hypothesis, Show answer (output table/summary table), and Conclusion based on the P value.arrow_forward
- A company found that the daily sales revenue of its flagship product follows a normal distribution with a mean of $4500 and a standard deviation of $450. The company defines a "high-sales day" that is, any day with sales exceeding $4800. please provide a step by step on how to get the answers Q: What percentage of days can the company expect to have "high-sales days" or sales greater than $4800? Q: What is the sales revenue threshold for the bottom 10% of days? (please note that 10% refers to the probability/area under bell curve towards the lower tail of bell curve) Provide answers in the yellow cellsarrow_forwardBusiness Discussarrow_forwardThe following data represent total ventilation measured in liters of air per minute per square meter of body area for two independent (and randomly chosen) samples. Analyze these data using the appropriate non-parametric hypothesis testarrow_forward
 Glencoe Algebra 1, Student Edition, 9780079039897...AlgebraISBN:9780079039897Author:CarterPublisher:McGraw Hill
 Big Ideas Math A Bridge To Success Algebra 1: Stu...AlgebraISBN:9781680331141Author:HOUGHTON MIFFLIN HARCOURTPublisher:Houghton Mifflin Harcourt
 Functions and Change: A Modeling Approach to Coll...AlgebraISBN:9781337111348Author:Bruce Crauder, Benny Evans, Alan NoellPublisher:Cengage Learning
 Linear Algebra: A Modern IntroductionAlgebraISBN:9781285463247Author:David PoolePublisher:Cengage Learning