
Fundamentals of Biostatistics
8th Edition
ISBN: 9781305268920
Author: Bernard Rosner
Publisher: Cengage Learning
expand_more
expand_more
format_list_bulleted
Concept explainers
Videos
Textbook Question
Chapter 8, Problem 1P
Find the lower 2.5th percentile of an F distribution with 14 and 7 df. What symbol is used to denote this?
Expert Solution & Answer
To determine
Find the lower 2.5th percentile of an F distribution.
Answer to Problem 1P
The lower 2.5th percentile of an F distribution is 0.296.
Explanation of Solution
The symbol is used to denote lower 2.5th percentile of an F distribution is,
Step-by-step procedure to obtain the lower 2.5th percentile of an F distribution using the MINITAB software:
- Choose Graph > Probability Distribution Plot choose View Probability> OK.
- From Distribution, choose F.
- Enter Numerator df as 14 and Denominator df as 7.
- Click the Shaded Area tab.
- Choose Probability Value and Left Tail for the region of the curve to shade.
- Enter the Probability Value as 0.025.
- Click OK.
Output using the MINITAB software is given below:
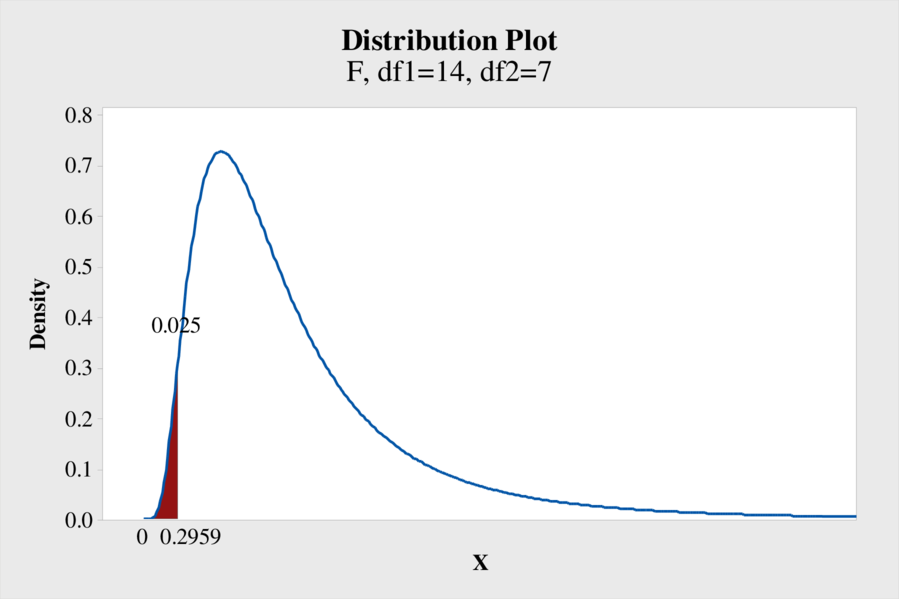
From the output, the lower 2.5th percentile of an F distribution is 0.296.
Want to see more full solutions like this?
Subscribe now to access step-by-step solutions to millions of textbook problems written by subject matter experts!
Students have asked these similar questions
BUSINESS DISCUSS
A researcher wishes to estimate, with 90% confidence, the population proportion of adults who support labeling
legislation for genetically modified organisms (GMOs). Her estimate must be accurate within 4% of the true proportion.
(a) No preliminary estimate is available. Find the minimum sample size needed.
(b) Find the minimum sample size needed, using a prior study that found that 65% of the respondents said they support
labeling legislation for GMOs.
(c) Compare the results from parts (a) and (b).
...
(a) What is the minimum sample size needed assuming that no prior information is available?
n =
(Round up to the nearest whole number as needed.)
The table available below shows the costs per mile (in cents) for a sample of automobiles. At a = 0.05, can you conclude that at least one mean
cost per mile is different from the others?
Click on the icon to view the data table.
Let Hss, HMS, HLS, Hsuv and Hмy represent the mean costs per mile for small sedans, medium sedans, large sedans, SUV 4WDs, and minivans
respectively. What are the hypotheses for this test?
OA. Ho: Not all the means are equal.
Ha Hss HMS HLS HSUV HMV
B. Ho Hss HMS HLS HSUV = μMV
Ha: Hss *HMS *HLS*HSUV * HMV
C. Ho Hss HMS HLS HSUV =μMV
= =
H: Not all the means are equal.
D. Ho Hss HMS
HLS HSUV HMV
Ha Hss HMS
HLS =HSUV = HMV
Chapter 8 Solutions
Fundamentals of Biostatistics
Ch. 8 - Find the lower 2.5th percentile of an F...Ch. 8 - The mean 1 sd of ln [calcium intake (mg)] among 25...Ch. 8 - The mean 1 sd of ln [calcium intake (mg)] among 25...Ch. 8 - The mean 1 sd of ln [calcium intake (mg)] among 25...Ch. 8 - The mean 1 sd of ln [calcium intake (mg)] among 25...Ch. 8 - The mean 1 sd of ln [calcium intake (mg)] among 25...Ch. 8 - The mean 1 sd of ln [calcium intake (mg)] among 25...Ch. 8 - The mean 1 sd of ln [calcium intake (mg)] among 25...Ch. 8 - The mean 1 sd of ln [calcium intake (mg)] among 25...Ch. 8 - The mean 1 sd of ln [calcium intake (mg)] among 25...
Ch. 8 - The mean 1 sd of ln [calcium intake (mg)] among 25...Ch. 8 - The mean 1 sd of ln [calcium intake (mg)] among 25...Ch. 8 - The mean 1 sd of ln [calcium intake (mg)] among 25...Ch. 8 - Refer to the data in Table 2.13. Table 2.13...Ch. 8 - Refer to the data in Table 2.13. What is the...Ch. 8 - Refer to the data in Table 2.13. Perform the...Ch. 8 - Refer to the data in Table 2.13. What is the...Ch. 8 - Refer to the data in Table 2.13. Compute a 95% CI...Ch. 8 - The drug diflunisal is used to treat mild to...Ch. 8 - The drug diflunisal is used to treat mild to...Ch. 8 - The drug diflunisal is used to treat mild to...Ch. 8 - The drug diflunisal is used to treat mild to...Ch. 8 - A study in Pittsburgh measured various...Ch. 8 - A study in Pittsburgh measured various...Ch. 8 - A 1980 study was conducted whose purpose was to...Ch. 8 - A 1980 study was conducted whose purpose was to...Ch. 8 - A 1980 study was conducted whose purpose was to...Ch. 8 - A camera has been developed to detect the presence...Ch. 8 - A camera has been developed to detect the presence...Ch. 8 - A camera has been developed to detect the presence...Ch. 8 - Prob. 31PCh. 8 - Prob. 32PCh. 8 - Prob. 33PCh. 8 - A possible important environmental determinant of...Ch. 8 - A possible important environmental determinant of...Ch. 8 - A possible important environmental determinant of...Ch. 8 - A possible important environmental determinant of...Ch. 8 - Prob. 38PCh. 8 - The degree of clinical agreement among physicians...Ch. 8 - The degree of clinical agreement among physicians...Ch. 8 - The degree of clinical agreement among physicians...Ch. 8 - The degree of clinical agreement among physicians...Ch. 8 - The degree of clinical agreement among physicians...Ch. 8 - Ten patients with advanced diabetic nephropathy...Ch. 8 - Ten patients with advanced diabetic nephropathy...Ch. 8 - Ten patients with advanced diabetic nephropathy...Ch. 8 - Ten patients with advanced diabetic nephropathy...Ch. 8 - A study was conducted of genetic and environmental...Ch. 8 - A study was conducted of genetic and environmental...Ch. 8 - Prob. 51PCh. 8 - Prob. 52PCh. 8 - Prob. 53PCh. 8 - Prob. 54PCh. 8 - Prob. 55PCh. 8 - Prob. 56PCh. 8 - Prob. 57PCh. 8 - Prob. 58PCh. 8 - Prob. 59PCh. 8 - Prob. 60PCh. 8 - Prob. 61PCh. 8 - Prob. 62PCh. 8 - Prob. 63PCh. 8 - A study was conducted [12] comparing muscle...Ch. 8 - Prob. 65PCh. 8 - A clinical trial compared percutaneous...Ch. 8 - Prob. 68PCh. 8 - Prob. 69PCh. 8 - An experiment was conducted to examine the...Ch. 8 - An experiment was conducted to examine the...Ch. 8 - An experiment was conducted to examine the...Ch. 8 - Prob. 73PCh. 8 - Prob. 74PCh. 8 - Prob. 75PCh. 8 - Prob. 77PCh. 8 - A study was performed looking at the effect of...Ch. 8 - A study was performed looking at the effect of...Ch. 8 - A study was performed looking at the effect of...Ch. 8 - Prob. 81PCh. 8 - Prob. 82PCh. 8 - Prob. 83PCh. 8 - Tennis elbow is a painful condition that afflicts...Ch. 8 - Prob. 85PCh. 8 - Prob. 86PCh. 8 - Prob. 87PCh. 8 - Prob. 88PCh. 8 - A study compared mean electroretinogram (ERG)...Ch. 8 - A study compared mean electroretinogram (ERG)...Ch. 8 - A study compared mean electroretinogram (ERG)...Ch. 8 - A study compared mean electroretinogram (ERG)...Ch. 8 - A study compared mean electroretinogram (ERG)...Ch. 8 - Prob. 94PCh. 8 - Prob. 95PCh. 8 - Prob. 96PCh. 8 - Prob. 98PCh. 8 - A study was performed to determine the effect of...Ch. 8 - A study was performed to determine the effect of...Ch. 8 - A study was performed to determine the effect of...Ch. 8 - A study was performed to determine the effect of...Ch. 8 - A study is being planned to assess whether a...Ch. 8 - A study is being planned to assess whether a...Ch. 8 - Prob. 105PCh. 8 - Prob. 106PCh. 8 - Left ventricular mass (LVM) is an important risk...Ch. 8 - Left ventricular mass (LVM) is an important risk...Ch. 8 - Prob. 109PCh. 8 - Prob. 110PCh. 8 - Prob. 111PCh. 8 - A study sought to demonstrate that soy beans...Ch. 8 - Prob. 113PCh. 8 - A study sought to demonstrate that soy beans...Ch. 8 - study was recently reported comparing the effects...Ch. 8 - study was recently reported comparing the effects...Ch. 8 - study was recently reported comparing the effects...Ch. 8 - study was recently reported comparing the effects...Ch. 8 - The Diabetes Prevention Study was a randomized...Ch. 8 - Prob. 122PCh. 8 - Prob. 123PCh. 8 - Prob. 124PCh. 8 - Prob. 125PCh. 8 - Prob. 126PCh. 8 - Prob. 127PCh. 8 - A study looked at the influence of retirement on...Ch. 8 - Cigarette smoking has important health...Ch. 8 - Cigarette smoking has important health...Ch. 8 - Cigarette smoking has important health...Ch. 8 - Cigarette smoking has important health...Ch. 8 - Cigarette smoking has important health...Ch. 8 - Prob. 134PCh. 8 - Prob. 135PCh. 8 - Prob. 136PCh. 8 - Prob. 137PCh. 8 - Prob. 138PCh. 8 - Prob. 142PCh. 8 - Prob. 143PCh. 8 - Prob. 144PCh. 8 - Prob. 145PCh. 8 - A study of genetic factors related to coronary...Ch. 8 - A study of genetic factors related to coronary...Ch. 8 - A study of genetic factors related to coronary...Ch. 8 - Prob. 149PCh. 8 - Prob. 150PCh. 8 - Prob. 151PCh. 8 - Prob. 152PCh. 8 - Prob. 153PCh. 8 - Prob. 154PCh. 8 - Prob. 155PCh. 8 - An individual has been exercising at a local gym...Ch. 8 - Prob. 157PCh. 8 - Suppose we have two groups with sample sizes of 8...Ch. 8 - Suppose we have two groups with sample sizes of 8...Ch. 8 - Suppose we have two groups with sample sizes of 8...Ch. 8 - In a 5-year follow-up of bilateral stimulation of...Ch. 8 - In a 5-year follow-up of bilateral stimulation of...Ch. 8 - In a 5-year follow-up of bilateral stimulation of...Ch. 8 - The following data are from a study on Botox...Ch. 8 - The following data are from a study on Botox...Ch. 8 - Prob. 166PCh. 8 - Prob. 167PCh. 8 - Prob. 168PCh. 8 - The EPIC-Norfolk study, a study of diet and cancer...Ch. 8 - Prob. 170PCh. 8 - Prob. 171PCh. 8 - Prob. 172PCh. 8 - Prob. 173PCh. 8 - Prob. 174PCh. 8 - Prob. 175PCh. 8 - Prob. 176P
Knowledge Booster


Learn more about
Need a deep-dive on the concept behind this application? Look no further. Learn more about this topic, statistics and related others by exploring similar questions and additional content below.Similar questions
- Question: A company launches two different marketing campaigns to promote the same product in two different regions. After one month, the company collects the sales data (in units sold) from both regions to compare the effectiveness of the campaigns. The company wants to determine whether there is a significant difference in the mean sales between the two regions. Perform a two sample T-test You can provide your answer by inserting a text box and the answer must include: Null hypothesis, Alternative hypothesis, Show answer (output table/summary table), and Conclusion based on the P value. (2 points = 0.5 x 4 Answers) Each of these is worth 0.5 points. However, showing the calculation is must. If calculation is missing, the whole answer won't get any credit.arrow_forwardBinomial Prob. Question: A new teaching method claims to improve student engagement. A survey reveals that 60% of students find this method engaging. If 15 students are randomly selected, what is the probability that: a) Exactly 9 students find the method engaging?b) At least 7 students find the method engaging? (2 points = 1 x 2 answers) Provide answers in the yellow cellsarrow_forwardIn a survey of 2273 adults, 739 say they believe in UFOS. Construct a 95% confidence interval for the population proportion of adults who believe in UFOs. A 95% confidence interval for the population proportion is ( ☐, ☐ ). (Round to three decimal places as needed.)arrow_forward
- Find the minimum sample size n needed to estimate μ for the given values of c, σ, and E. C=0.98, σ 6.7, and E = 2 Assume that a preliminary sample has at least 30 members. n = (Round up to the nearest whole number.)arrow_forwardIn a survey of 2193 adults in a recent year, 1233 say they have made a New Year's resolution. Construct 90% and 95% confidence intervals for the population proportion. Interpret the results and compare the widths of the confidence intervals. The 90% confidence interval for the population proportion p is (Round to three decimal places as needed.) J.D) .arrow_forwardLet p be the population proportion for the following condition. Find the point estimates for p and q. In a survey of 1143 adults from country A, 317 said that they were not confident that the food they eat in country A is safe. The point estimate for p, p, is (Round to three decimal places as needed.) ...arrow_forward
- (c) Because logistic regression predicts probabilities of outcomes, observations used to build a logistic regression model need not be independent. A. false: all observations must be independent B. true C. false: only observations with the same outcome need to be independent I ANSWERED: A. false: all observations must be independent. (This was marked wrong but I have no idea why. Isn't this a basic assumption of logistic regression)arrow_forwardBusiness discussarrow_forwardSpam filters are built on principles similar to those used in logistic regression. We fit a probability that each message is spam or not spam. We have several variables for each email. Here are a few: to_multiple=1 if there are multiple recipients, winner=1 if the word 'winner' appears in the subject line, format=1 if the email is poorly formatted, re_subj=1 if "re" appears in the subject line. A logistic model was fit to a dataset with the following output: Estimate SE Z Pr(>|Z|) (Intercept) -0.8161 0.086 -9.4895 0 to_multiple -2.5651 0.3052 -8.4047 0 winner 1.5801 0.3156 5.0067 0 format -0.1528 0.1136 -1.3451 0.1786 re_subj -2.8401 0.363 -7.824 0 (a) Write down the model using the coefficients from the model fit.log_odds(spam) = -0.8161 + -2.5651 + to_multiple + 1.5801 winner + -0.1528 format + -2.8401 re_subj(b) Suppose we have an observation where to_multiple=0, winner=1, format=0, and re_subj=0. What is the predicted probability that this message is spam?…arrow_forward
- Consider an event X comprised of three outcomes whose probabilities are 9/18, 1/18,and 6/18. Compute the probability of the complement of the event. Question content area bottom Part 1 A.1/2 B.2/18 C.16/18 D.16/3arrow_forwardJohn and Mike were offered mints. What is the probability that at least John or Mike would respond favorably? (Hint: Use the classical definition.) Question content area bottom Part 1 A.1/2 B.3/4 C.1/8 D.3/8arrow_forwardThe details of the clock sales at a supermarket for the past 6 weeks are shown in the table below. The time series appears to be relatively stable, without trend, seasonal, or cyclical effects. The simple moving average value of k is set at 2. What is the simple moving average root mean square error? Round to two decimal places. Week Units sold 1 88 2 44 3 54 4 65 5 72 6 85 Question content area bottom Part 1 A. 207.13 B. 20.12 C. 14.39 D. 0.21arrow_forward
arrow_back_ios
SEE MORE QUESTIONS
arrow_forward_ios
Recommended textbooks for you
 Holt Mcdougal Larson Pre-algebra: Student Edition...AlgebraISBN:9780547587776Author:HOLT MCDOUGALPublisher:HOLT MCDOUGAL
 Glencoe Algebra 1, Student Edition, 9780079039897...AlgebraISBN:9780079039897Author:CarterPublisher:McGraw Hill
 Big Ideas Math A Bridge To Success Algebra 1: Stu...AlgebraISBN:9781680331141Author:HOUGHTON MIFFLIN HARCOURTPublisher:Houghton Mifflin Harcourt
 College Algebra (MindTap Course List)AlgebraISBN:9781305652231Author:R. David Gustafson, Jeff HughesPublisher:Cengage Learning
 Algebra: Structure And Method, Book 1AlgebraISBN:9780395977224Author:Richard G. Brown, Mary P. Dolciani, Robert H. Sorgenfrey, William L. ColePublisher:McDougal Littell
Holt Mcdougal Larson Pre-algebra: Student Edition...
Algebra
ISBN:9780547587776
Author:HOLT MCDOUGAL
Publisher:HOLT MCDOUGAL
Glencoe Algebra 1, Student Edition, 9780079039897...
Algebra
ISBN:9780079039897
Author:Carter
Publisher:McGraw Hill
Big Ideas Math A Bridge To Success Algebra 1: Stu...
Algebra
ISBN:9781680331141
Author:HOUGHTON MIFFLIN HARCOURT
Publisher:Houghton Mifflin Harcourt
College Algebra (MindTap Course List)
Algebra
ISBN:9781305652231
Author:R. David Gustafson, Jeff Hughes
Publisher:Cengage Learning
Algebra: Structure And Method, Book 1
Algebra
ISBN:9780395977224
Author:Richard G. Brown, Mary P. Dolciani, Robert H. Sorgenfrey, William L. Cole
Publisher:McDougal Littell
Statistics 4.1 Introduction to Inferential Statistics; Author: Dr. Jack L. Jackson II;https://www.youtube.com/watch?v=QLo4TEvBvK4;License: Standard YouTube License, CC-BY