Applications and Investigations in Earth Science (9th Edition)
9th Edition
ISBN: 9780134746241
Author: Edward J. Tarbuck, Frederick K. Lutgens, Dennis G. Tasa
Publisher: PEARSON
expand_more
expand_more
format_list_bulleted
Textbook Question
Chapter 7.4, Problem 2A
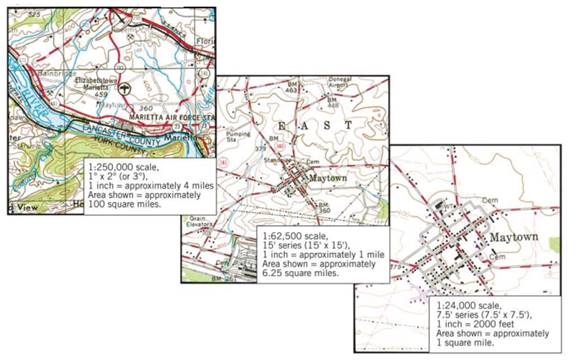
Examine Figure 7.6 and complete the map description by choosing the appropriate terms: (smaller or larger) (more or less). Maps with small fractional scales (e.g., 1:250, 000) cover a ______area and provide ______detail. Maps with large fractional scales (e.g., 1:24, 000) cover a ______area and provide ______detail.

Expert Solution & Answer
Learn your wayIncludes step-by-step video

schedule01:48
Students have asked these similar questions
Think about natural resource management topics. Which topic or topics, are most interesting?
Think about natural resource management topics. Which topic or topics, if any, are of most interest to you?
Weathering, erosion,
transportation, deposition
Compaction, cementation, chemical
actions (Lithification)
Sediment
Igneous
rocks
Cooling, solidification
(Crystallization)
Magma
From
mantle
New material
Melting
added from depth
(Metam
Heat, inter
Sedimentary
rocks
Metamorphic
rocks
Chapter 7 Solutions
Applications and Investigations in Earth Science (9th Edition)
Ch. 7.1 - Obtain a stereoscope from your instructor, unfold...Ch. 7.1 - Prob. 2ACh. 7.1 - Prob. 3ACh. 7.1 - Prob. 4ACh. 7.2 - Prob. 1ACh. 7.2 - Prob. 2ACh. 7.3 - Prob. 1ACh. 7.3 - Prob. 3ACh. 7.3 - Prob. 6ACh. 7.4 - Depending on the map scale, 1 inch on a...
Ch. 7.4 - Examine Figure 7.6 and complete the map...Ch. 7.6 - The difference in elevation between adjacent...Ch. 7.6 - What is the difference in elevation between Points...Ch. 7.6 - Notice that every fifth contour line, called an...Ch. 7.6 - Prob. 4ACh. 7.6 - One or more roughly circular closed contours...Ch. 7.6 - Closed contours with hachures short lines that...Ch. 7.6 - When contour lines cross streams or dry stream...Ch. 7.6 - Estimating the elevations of places not located on...Ch. 7.6 - Relief is defined as the difference in elevation...Ch. 7.7 - Use the elevations in Figure 7.12 as a guide for...Ch. 7.7 - Does the land shown on the topographic map you...Ch. 7.7 - Use the profile graph in Figure 7.14 to construct...Ch. 7.8 - Use the profile graph in Figure 7.14 to construct...Ch. 7.9 - What is the contour interval of this map?Ch. 7.9 - What is the difference in elevation from one index...Ch. 7.9 - Prob. 3ACh. 7.9 - Locate the small intermittent stream blue dashed...Ch. 7.9 - What is the approximate elevation of the point...Ch. 7.9 - What is the approximate relief between point X and...Ch. 7.9 - Which of the following phrases best describes the...Ch. 7.9 - The area on both sides of Tennessee Creek in...Ch. 7.9 - Describe the change in elevation you would...Ch. 7.9 - What is the elevation of the town of Leadville,...Ch. 7.9 - Prob. 11ACh. 7 - Determine the contour interval used on this map...Ch. 7 - List the elevations of each index contour on the...Ch. 7 - What are the elevations of the locations...Ch. 7 - What is the elevation of the church? Elevation of...Ch. 7 - Indicate two areas on this map that have steep...Ch. 7 - Describe the relief of Sandy Spit with one of the...Ch. 7 - Mark the top of the hill in the northeast corner...Ch. 7 - Is the top of Picture Ridge, designated Y, at a...Ch. 7 - What is the maximum relief shown on this contour...Ch. 7 - Imagine that you are taking a group of friends...Ch. 7 - Use the satellite images in figure 7.17, which...
Additional Science Textbook Solutions
Find more solutions based on key concepts
The light reactions of photosynthesis supply the Calvin cycle with A. light energy. B. CO2 and ATP. C. O2 and N...
Campbell Biology in Focus (2nd Edition)
MAKE CONNECTIONS Using what you know of gene expression in a cell, explain what causes the traits of parents (...
Campbell Biology (11th Edition)
Where is transitional epithelium found and what is its importance at those sites?
Anatomy & Physiology (6th Edition)
What is the molarity of an aqueous solution that is 5.88% NaCl by mass? (Assume a density of 1.02 g/mL for the ...
Introductory Chemistry (6th Edition)
Match each of the following items with all the terms it applies to:
Human Physiology: An Integrated Approach (8th Edition)
41. A reaction in which A, B, and C react to form products is first order in A, second order in B, and zero ord...
Chemistry: Structure and Properties (2nd Edition)
Knowledge Booster
Similar questions
- Discussion Question: Essentials of Geography A+ Chapter 1 does a nice job introducing the Physical Earth Sciences with the traditional scientific methods and systems. However, Physical Geography exemplifies understanding spatial patterns. For example, we could research an area's cases of West Nile Virus using a table filled with location and number of deaths and it would be useful. However, an even better way to look at the information in order to search for an underlying pattern and an explanation would be to map the data. For the Chapter 1 Discussion, find a thematic map from your house, the Newspaper, the Internet, the textbook, or wherever you find one! Be sure to include the source such that any of us can get our hands on the same information/map. First DESCRIBE the patterns that you see. Then, INTERPRET the reasons for the pattern. For example,the figures above and below are maps with information plotted. Remember, descriptions are not arguable. Descriptions are factual…arrow_forwardWhat are the latitude and longitude of Points A through D on the figure below? Please remember latitude is given first and is always north or south of the equator. Then, longitude is given next and is always east or west of the prime meridian. Upload your answers as a file to the Assignments section.arrow_forwardConsider Cronon’s study of wilderness, as discussed by Kanazawa (2023). In what ways, if any, would it have been appropriate for Cronon to have used quantitative methods in his study of the concept of wilderness, and to what end? Why were qualitative methods particularly appropriate for the study, given the nature of his research topic?arrow_forward
- Google Earth Assingment HW 2 Earth 1050arrow_forward''Discuss the role of natural disasters in the global epidemiology of gastroenteritis over the last 10 years.'' Including case studies of natural disaster events and gastroenteritis outbreaks (must be within the past 10 years)arrow_forwardWho wrote "there is no one is not better who has spent time in the presence of stones"arrow_forward
- I need some help for Medical Microbiology , 'Discuss the role of natural disasters in the global epidemiology of gastroenteritis over the last 10 years.'arrow_forwardOrder this what come first 1.evaporation 2.transpiration 3. Warm air rises 4. Condensation 5. Precipitation 6.surface run off 7. Infiltration 8. Ground water storearrow_forwardI want to research desertification from 2020 to the presentarrow_forward
- How do i know where the arrows should point?arrow_forwardWhy is the Atlantic Ocean the saltiest ocean on Earth? In your explanation, use the terms “evaporation,” “precipitation,” “trade winds,” “Central America,” and “Pacific Ocean”.?arrow_forwardAt the large scale of the major ocean basins, do ocean currents tend to flow in a cyclonic or anti-cyclonic direction? How is this evidenced in the map of average sea-surface temperatures belowarrow_forward
arrow_back_ios
SEE MORE QUESTIONS
arrow_forward_ios
Recommended textbooks for you
 Applications and Investigations in Earth Science ...Earth ScienceISBN:9780134746241Author:Edward J. Tarbuck, Frederick K. Lutgens, Dennis G. TasaPublisher:PEARSON
 Exercises for Weather & Climate (9th Edition)Earth ScienceISBN:9780134041360Author:Greg CarbonePublisher:PEARSON
 Environmental ScienceEarth ScienceISBN:9781260153125Author:William P Cunningham Prof., Mary Ann Cunningham ProfessorPublisher:McGraw-Hill Education
 Earth Science (15th Edition)Earth ScienceISBN:9780134543536Author:Edward J. Tarbuck, Frederick K. Lutgens, Dennis G. TasaPublisher:PEARSON
 Environmental Science (MindTap Course List)Earth ScienceISBN:9781337569613Author:G. Tyler Miller, Scott SpoolmanPublisher:Cengage Learning
 Physical GeologyEarth ScienceISBN:9781259916823Author:Plummer, Charles C., CARLSON, Diane H., Hammersley, LisaPublisher:Mcgraw-hill Education,

Applications and Investigations in Earth Science ...
Earth Science
ISBN:9780134746241
Author:Edward J. Tarbuck, Frederick K. Lutgens, Dennis G. Tasa
Publisher:PEARSON

Exercises for Weather & Climate (9th Edition)
Earth Science
ISBN:9780134041360
Author:Greg Carbone
Publisher:PEARSON

Environmental Science
Earth Science
ISBN:9781260153125
Author:William P Cunningham Prof., Mary Ann Cunningham Professor
Publisher:McGraw-Hill Education

Earth Science (15th Edition)
Earth Science
ISBN:9780134543536
Author:Edward J. Tarbuck, Frederick K. Lutgens, Dennis G. Tasa
Publisher:PEARSON

Environmental Science (MindTap Course List)
Earth Science
ISBN:9781337569613
Author:G. Tyler Miller, Scott Spoolman
Publisher:Cengage Learning

Physical Geology
Earth Science
ISBN:9781259916823
Author:Plummer, Charles C., CARLSON, Diane H., Hammersley, Lisa
Publisher:Mcgraw-hill Education,