
Essentials of Business Analytics (MindTap Course List)
2nd Edition
ISBN: 9781305627734
Author: Jeffrey D. Camm, James J. Cochran, Michael J. Fry, Jeffrey W. Ohlmann, David R. Anderson
Publisher: Cengage Learning
expand_more
expand_more
format_list_bulleted
Videos
Textbook Question
Chapter 7, Problem 7P
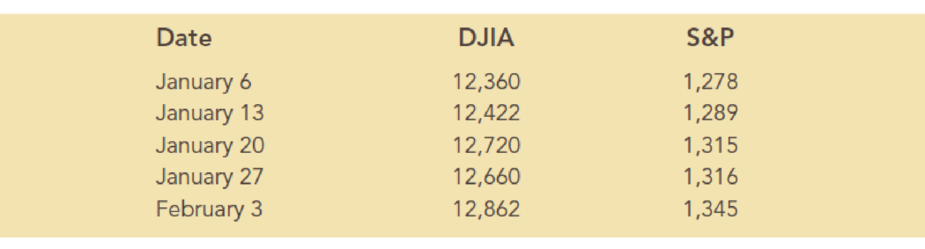
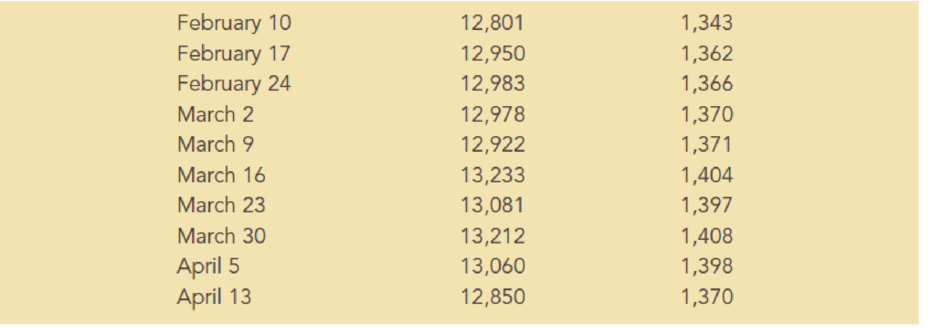
The Dow Jones Industrial Average (DJIA) and the Standard & Poor’s 500 (S&P 500) indexes are used as measures of overall movement in the stock market The DJIA is based on the price movements of 30 large companies: the S&P 500 is an index composed of 500 stocks. Some say the S&P 500 is a better measure of stock market performance because it is broader based. The closing price for the DJIA and the S&P 500 for 15 weeks, beginning with January 6, 2012, follow (Barron’s web site, April 17, 2012).
- a. Develop a scatter chart for these data with DJIA as the independent variable. What does the scatter chart indicate about the relationship between DJIA and S&P 500?
- b. Develop an estimated regression equation showing how S&P 500 is related to DJIA. What is the estimated regression model?
- c. What is the 95% confidence interval for the regression parameter β1? Based on this interval, what conclusion can you make about the hypotheses that the regression parameter β1 is equal to zero?
- d. What is the 95% confidence interval for the regression parameter β0? Based on this interval, what conclusion can you make about the hypotheses that the regression parameter β0 is equal to zero?
- e. How much of the variation in the sample values of S&P 500 does the model estimated in part (b) explain?
- f. Suppose that the closing price for the DJIA is 13,500. Estimate the closing price for the S&P 500.
- g. Should we be concerned that the DJIA value of 13,500 used to predict the S&P 500 value in part (f) is beyond the
range of the DJIA used to develop the estimated regression equation?
Expert Solution & Answer

Trending nowThis is a popular solution!

Students have asked these similar questions
A quality characteristic of a product is normally distributed with mean μ and standard deviation σ = 1. Speci-
fications on the characteristic are 6≤x≤8. A unit that falls within specifications on this quality characteristic
results in a profit of Co. However, if x 8, the profit is -C2. Find the value
ofμ that maximizes the expected profit.
A) The output voltage of a power supply is normally distributed with mean 5 V and standard deviation 0.02 V. If
the lower and upper specifications for voltage are 4.95 V and 5.05 V, respectively, what is the probability that a
power supply selected at random conform to the specifications on voltage?
B)
Continuation of A. Reconsider the power supply manufacturing process in A. Suppose
We wanted to improve the process. Can shifting the mean reduce the number of nonconforming units produced?
How much would the process variability need to be reduced in order to have all but one out of 1000 units conform
to the specifications?
der to complete the Case X
T Civil Service Numerical Test Sec X T Casework Skills Practice Test
Maseline
Vaseline
x +
euauthoring.panpowered.com/DeliveryWeb/Civil Service Main/84589a48-6934-4b6e-a6e1-a5d75f559df9?transferToken-News NGSSON
The table below shows the best price available for various items from 4 uniform suppliers. The prices do not include VAT
(charged at 20%).
Item
Waterproof boots
A1-Uniforms (£)Best Trade (£)Clothing Tech (£)Dress Right (£)
59.99
39.99
59.99
49.99
Trousers
9.89
9.98
9.99
11.99
Shirts
14.99
15.99
16.99
12.99
Hi-Vis vest
4.49
4.50
4.00
4.00
20.00
25.00
19.50
19.99
Hard hats
A company needs to buy a set of 12 uniforms which includes 1 of each item. If the special offers are included
which supplier is cheapest?
OOO
A1-Uniforms
Best Trade
Clothing Tech
Q Search
+
**
109
8
CO*
F10
Home
F11
F12
6
Chapter 7 Solutions
Essentials of Business Analytics (MindTap Course List)
Ch. 7 - Bicycling World, a magazine devoted to cycling,...Ch. 7 - In a manufacturing process the assembly line speed...Ch. 7 - Jensen Tire Auto is deciding whether to purchase...Ch. 7 - A sociologist was hired by a large city hospital...Ch. 7 - The regional transit authority for a major...Ch. 7 - A marketing professor at Givens College is...Ch. 7 - The Dow Jones Industrial Average (DJIA) and the...Ch. 7 - The Toyota Camry is one of the best-selling cars...Ch. 7 - Dixie Showtime Movie Theaters, Inc., owns and...Ch. 7 - Prob. 10P
Ch. 7 - The American Association of Individual Investors...Ch. 7 - The National Football League (NFL) records a...Ch. 7 - Johnson Filtration. Inc., provides maintenance...Ch. 7 - A study investigated the relationship between...Ch. 7 - The U.S. Department of Energys Fuel Economy Guide...Ch. 7 - A highway department is studying the relationship...Ch. 7 - A sample containing years to maturity and...Ch. 7 - In 2011, home prices and mortgage rates fell so...Ch. 7 - A recent 10-year study conducted by a research...Ch. 7 - The Scholastic Aptitude Test (or SAT) is a...Ch. 7 - Consider again the example introduced in Section...Ch. 7 - Alumni donations are an important source of...
Knowledge Booster


Learn more about
Need a deep-dive on the concept behind this application? Look no further. Learn more about this topic, statistics and related others by exploring similar questions and additional content below.Similar questions
- to complete the Case × T Civil Service Numerical Test Sec x T Casework Skills Practice Test + Vaseline euauthoring.panpowered.com/DeliveryWeb/Civil Service Main/84589a48-b934-4b6e-a6e1-a5d75f559df9?transferToken=MxNewOS NGFSPSZSMOMzuz The table below shows the best price available for various items from 4 uniform suppliers. The prices do not include VAT (charged at 20%). Item A1-Uniforms (£)Best Trade (£)Clothing Tech (£)Dress Right (£) Waterproof boots 59.99 39.99 59.99 49.99 Trousers 9.89 9.98 9.99 11.99 Shirts 14.99 15.99 16.99 12.99 Hi-Vis vest 4.49 4.50 4.00 4.00 20.00 25.00 19.50 19.99 Hard hats A company needs to buy a set of 12 uniforms which includes 1 of each item. If the special offers are included, which supplier is cheapest? O O O O A1-Uniforms Best Trade Clothing Tech Dress Right Q Search ENG L UK +0 F6 四吧 6 78 ㄓ F10 9% * CO 1 F12 34 Oarrow_forwardCritics review films out of 5 based on three attributes: the story, the special effects and the acting. The ratings of four critics for a film are collected in the table below.CriticSpecialStory rating Effects rating Acting rating Critic 14.44.34.5Critic 24.14.23.9Critic 33.943.4Critic 44.24.14.2Critic 1 also gave the film a rating for the Director's ability. If the average of Critic 1's ratings was 4.3 what rating did they give to the Director's ability?3.94.04.14.24.3arrow_forwardTwo measurements are made of some quantity. For the first measurement, the average is 74.4528, the RMS error is 6.7441, and the uncertainty of the mean is 0.9264. For the second one, the average is 76.8415, the standard deviation is 8.3348, and the uncertainty of the mean is 1.1448. The expected value is exactly 75. 13. Express the first measurement in public notation. 14. Is there a significant difference between the two measurements? 1 15. How does the first measurement compare with the expected value? 16. How does the second measurement compare with the expected value?arrow_forward
- A hat contains slips of paper numbered 1 through 6. You draw two slips of paper at random from the hat,without replacing the first slip into the hat.(a) (5 points) Write out the sample space S for this experiment.(b) (5 points) Express the event E : {the sum of the numbers on the slips of paper is 4} as a subset of S.(c) (5 points) Find P(E)(d) (5 points) Let F = {the larger minus the smaller number is 0}. What is P(F )?(e) (5 points) Are E and F disjoint? Why or why not?(f) (5 points) Find P(E ∪ F )arrow_forwardIn addition to the in-school milk supplement program, the nurse would like to increase the use of daily vitamin supplements for the children by visiting homes and educating about the merits of vitamins. She believes that currently, about 50% of families with school-age children give the children a daily megavitamin. She would like to increase this to 70%. She plans a two-group study, where one group serves as a control and the other group receives her visits. How many families should she expect to visit to have 80% power of detecting this difference? Assume that drop-out rate is 5%.arrow_forwardA recent survey of 400 americans asked whether or not parents do too much for their young adult children. The results of the survey are shown in the data file. a) Construct the frequency and relative frequency distributions. How many respondents felt that parents do too much for their adult children? What proportion of respondents felt that parents do too little for their adult children? b) Construct a pie chart. Summarize the findingsarrow_forward
- The average number of minutes Americans commute to work is 27.7 minutes (Sterling's Best Places, April 13, 2012). The average commute time in minutes for 48 cities are as follows: Click on the datafile logo to reference the data. DATA file Albuquerque 23.3 Jacksonville 26.2 Phoenix 28.3 Atlanta 28.3 Kansas City 23.4 Pittsburgh 25.0 Austin 24.6 Las Vegas 28.4 Portland 26.4 Baltimore 32.1 Little Rock 20.1 Providence 23.6 Boston 31.7 Los Angeles 32.2 Richmond 23.4 Charlotte 25.8 Louisville 21.4 Sacramento 25.8 Chicago 38.1 Memphis 23.8 Salt Lake City 20.2 Cincinnati 24.9 Miami 30.7 San Antonio 26.1 Cleveland 26.8 Milwaukee 24.8 San Diego 24.8 Columbus 23.4 Minneapolis 23.6 San Francisco 32.6 Dallas 28.5 Nashville 25.3 San Jose 28.5 Denver 28.1 New Orleans 31.7 Seattle 27.3 Detroit 29.3 New York 43.8 St. Louis 26.8 El Paso 24.4 Oklahoma City 22.0 Tucson 24.0 Fresno 23.0 Orlando 27.1 Tulsa 20.1 Indianapolis 24.8 Philadelphia 34.2 Washington, D.C. 32.8 a. What is the mean commute time for…arrow_forwardMorningstar tracks the total return for a large number of mutual funds. The following table shows the total return and the number of funds for four categories of mutual funds. Click on the datafile logo to reference the data. DATA file Type of Fund Domestic Equity Number of Funds Total Return (%) 9191 4.65 International Equity 2621 18.15 Hybrid 1419 2900 11.36 6.75 Specialty Stock a. Using the number of funds as weights, compute the weighted average total return for these mutual funds. (to 2 decimals) % b. Is there any difficulty associated with using the "number of funds" as the weights in computing the weighted average total return in part (a)? Discuss. What else might be used for weights? The input in the box below will not be graded, but may be reviewed and considered by your instructor. c. Suppose you invested $10,000 in this group of mutual funds and diversified the investment by placing $2000 in Domestic Equity funds, $4000 in International Equity funds, $3000 in Specialty Stock…arrow_forwardThe days to maturity for a sample of five money market funds are shown here. The dollar amounts invested in the funds are provided. Days to Maturity 20 Dollar Value ($ millions) 20 12 30 7 10 5 6 15 10 Use the weighted mean to determine the mean number of days to maturity for dollars invested in these five money market funds (to 1 decimal). daysarrow_forward
- c. What are the first and third quartiles? First Quartiles (to 1 decimals) Third Quartiles (to 4 decimals) × ☑ Which companies spend the most money on advertising? Business Insider maintains a list of the top-spending companies. In 2014, Procter & Gamble spent more than any other company, a whopping $5 billion. In second place was Comcast, which spent $3.08 billion (Business Insider website, December 2014). The top 12 companies and the amount each spent on advertising in billions of dollars are as follows. Click on the datafile logo to reference the data. DATA file Company Procter & Gamble Comcast Advertising ($billions) $5.00 3.08 2.91 Company American Express General Motors Advertising ($billions) $2.19 2.15 ETET AT&T Ford Verizon L'Oreal 2.56 2.44 2.34 Toyota Fiat Chrysler Walt Disney Company J.P Morgan a. What is the mean amount spent on advertising? (to 2 decimals) 2.55 b. What is the median amount spent on advertising? (to 3 decimals) 2.09 1.97 1.96 1.88arrow_forwardMartinez Auto Supplies has retail stores located in eight cities in California. The price they charge for a particular product in each city are vary because of differing competitive conditions. For instance, the price they charge for a case of a popular brand of motor oil in each city follows. Also shown are the number of cases that Martinez Auto sold last quarter in each city. City Price ($) Sales (cases) Bakersfield 34.99 501 Los Angeles 38.99 1425 Modesto 36.00 294 Oakland 33.59 882 Sacramento 40.99 715 San Diego 38.59 1088 San Francisco 39.59 1644 San Jose 37.99 819 Compute the average sales price per case for this product during the last quarter? Round your answer to two decimal places.arrow_forwardConsider the following data and corresponding weights. xi Weight(wi) 3.2 6 2.0 3 2.5 2 5.0 8 a. Compute the weighted mean (to 2 decimals). b. Compute the sample mean of the four data values without weighting. Note the difference in the results provided by the two computations (to 3 decimals).arrow_forward
arrow_back_ios
SEE MORE QUESTIONS
arrow_forward_ios
Recommended textbooks for you
 Glencoe Algebra 1, Student Edition, 9780079039897...AlgebraISBN:9780079039897Author:CarterPublisher:McGraw Hill
 Big Ideas Math A Bridge To Success Algebra 1: Stu...AlgebraISBN:9781680331141Author:HOUGHTON MIFFLIN HARCOURTPublisher:Houghton Mifflin Harcourt
 Holt Mcdougal Larson Pre-algebra: Student Edition...AlgebraISBN:9780547587776Author:HOLT MCDOUGALPublisher:HOLT MCDOUGAL
 College Algebra (MindTap Course List)AlgebraISBN:9781305652231Author:R. David Gustafson, Jeff HughesPublisher:Cengage Learning
Glencoe Algebra 1, Student Edition, 9780079039897...
Algebra
ISBN:9780079039897
Author:Carter
Publisher:McGraw Hill
Big Ideas Math A Bridge To Success Algebra 1: Stu...
Algebra
ISBN:9781680331141
Author:HOUGHTON MIFFLIN HARCOURT
Publisher:Houghton Mifflin Harcourt
Holt Mcdougal Larson Pre-algebra: Student Edition...
Algebra
ISBN:9780547587776
Author:HOLT MCDOUGAL
Publisher:HOLT MCDOUGAL
College Algebra (MindTap Course List)
Algebra
ISBN:9781305652231
Author:R. David Gustafson, Jeff Hughes
Publisher:Cengage Learning
Introduction to Statistical Quality Control (SQC); Author: FORSEdu;https://www.youtube.com/watch?v=c18FKHUDZv8;License: Standard YouTube License, CC-BY
[DAXX] Introduction to Statistical Quality Control; Author: The Academician;https://www.youtube.com/watch?v=ypZGDxjSM60;License: Standard Youtube License