
Essentials of Business Analytics (MindTap Course List)
2nd Edition
ISBN: 9781305627734
Author: Jeffrey D. Camm, James J. Cochran, Michael J. Fry, Jeffrey W. Ohlmann, David R. Anderson
Publisher: Cengage Learning
expand_more
expand_more
format_list_bulleted
Videos
Textbook Question
Chapter 7, Problem 15P
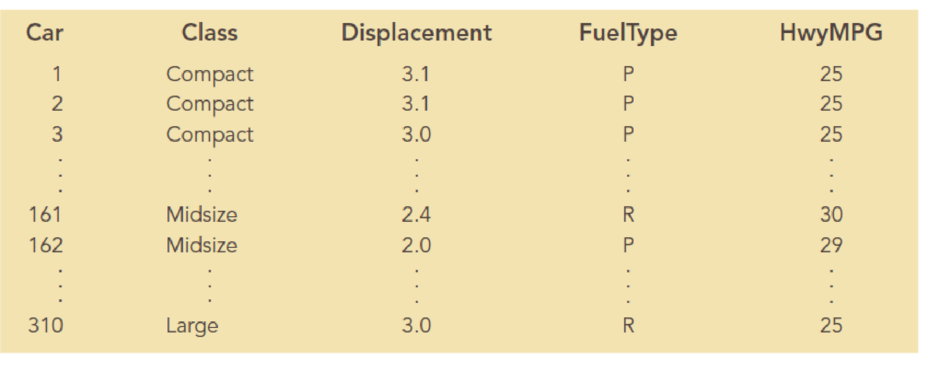
The U.S. Department of Energy’s Fuel Economy Guide provides fuel efficiency data for cars and trucks. A portion of the data for 311 compact, midsized, and large cars follows. The Class column identifies the size of the car: Compact, Midsize, or Large. The Displacement column shows the engine’s displacement in liters. The FuelType column shows whether the car uses premium (P) or regular (R) fuel, and the HwyMPG column shows the fuel efficiency rating for highway driving in terms of miles per gallon. The complete data set is contained in the tile FuelData:
- a. Develop an estimated regression equation that can be used to predict the fuel efficiency for highway driving given the engine’s displacement. Test for significance using the 0.05 level of significance. How much of the variation in the sample values of HwyMPG does this estimated regression equation explain?
- b. Create a scatter chart with HwyMPG on the y-axis and displacement on the x-axis for which the points representing compact, midsize, and large automobiles are shown in different shapes and/or colors. What does this chart suggest about the relationship between the class of automobile (compact, midsize, and large) and HwyMPG?
- c. Now consider the addition of the dummy variables ClassMidsize and ClassLarge to the simple linear regression model in part (a). The value of ClassMidsize is 1 if the car is a midsize car and 0 otherwise; the value of ClassLarge is 1 if the car is a large car and 0 otherwise. Thus, for a compact car, the value of ClassMidsize and the value of ClassLarge are both 0. Develop the estimated regression equation that can be used to predict the fuel efficiency for highway driving, given the engine’s displacement and the dummy variables ClassMidsize and ClassLarge. How much of the variation in the sample values of HwyMPG is explained by this estimated regression equation?
- d. Use significance level of 0.05 to determine whether the dummy variables added to the model in part (c) are significant.
- e. Consider the addition of the dummy variable FuelPremium, where the value of FuelPremium is 1 if the car uses premium fuel and 0 if the car uses regular fuel. Develop the estimated regression equation that can be used to predict the fuel efficiency for highway driving given the engine’s displacement, the dummy variables ClassMidsize and ClassLarge, and the dummy variable FuelPremium. How much of the variation in the sample values of HwyMPG does this estimated regression equation explain?
- f. For the estimated regression equation developed in part (e), test for the significance of the relationship between each of the independent variables and the dependent variable using the 0.05 level of significance for each test.
Expert Solution & Answer

Trending nowThis is a popular solution!

Students have asked these similar questions
7.1. If X has an exponential distribution with the
parameter 0, use the distribution function technique
to find the probability density of the random variable
Y = ln X.
bilaga in
dwreat
3. Please
What does the margin of error include? When a margin of error is reported for a survey, it includes
a. random sampling error and other practical difficulties like undercoverage and non-response
b. random sampling error, but not other practical difficulties like undercoverage and nonresponse
c. practical difficulties like undercoverage and nonresponse, but not random smapling error
d. none of the above is corret
Chapter 7 Solutions
Essentials of Business Analytics (MindTap Course List)
Ch. 7 - Bicycling World, a magazine devoted to cycling,...Ch. 7 - In a manufacturing process the assembly line speed...Ch. 7 - Jensen Tire Auto is deciding whether to purchase...Ch. 7 - A sociologist was hired by a large city hospital...Ch. 7 - The regional transit authority for a major...Ch. 7 - A marketing professor at Givens College is...Ch. 7 - The Dow Jones Industrial Average (DJIA) and the...Ch. 7 - The Toyota Camry is one of the best-selling cars...Ch. 7 - Dixie Showtime Movie Theaters, Inc., owns and...Ch. 7 - Prob. 10P
Ch. 7 - The American Association of Individual Investors...Ch. 7 - The National Football League (NFL) records a...Ch. 7 - Johnson Filtration. Inc., provides maintenance...Ch. 7 - A study investigated the relationship between...Ch. 7 - The U.S. Department of Energys Fuel Economy Guide...Ch. 7 - A highway department is studying the relationship...Ch. 7 - A sample containing years to maturity and...Ch. 7 - In 2011, home prices and mortgage rates fell so...Ch. 7 - A recent 10-year study conducted by a research...Ch. 7 - The Scholastic Aptitude Test (or SAT) is a...Ch. 7 - Consider again the example introduced in Section...Ch. 7 - Alumni donations are an important source of...
Knowledge Booster


Learn more about
Need a deep-dive on the concept behind this application? Look no further. Learn more about this topic, statistics and related others by exploring similar questions and additional content below.Similar questions
- solve the question based on hw 1, 1.41arrow_forwardT1.4: Let ẞ(G) be the minimum size of a vertex cover, a(G) be the maximum size of an independent set and m(G) = |E(G)|. (i) Prove that if G is triangle free (no induced K3) then m(G) ≤ a(G)B(G). Hints - The neighborhood of a vertex in a triangle free graph must be independent; all edges have at least one end in a vertex cover. (ii) Show that all graphs of order n ≥ 3 and size m> [n2/4] contain a triangle. Hints - you may need to use either elementary calculus or the arithmetic-geometric mean inequality.arrow_forwardWe consider the one-period model studied in class as an example. Namely, we assumethat the current stock price is S0 = 10. At time T, the stock has either moved up toSt = 12 (with probability p = 0.6) or down towards St = 8 (with probability 1−p = 0.4).We consider a call option on this stock with maturity T and strike price K = 10. Theinterest rate on the money market is zero.As in class, we assume that you, as a customer, are willing to buy the call option on100 shares of stock for $120. The investor, who sold you the option, can adopt one of thefollowing strategies: Strategy 1: (seen in class) Buy 50 shares of stock and borrow $380. Strategy 2: Buy 55 shares of stock and borrow $430. Strategy 3: Buy 60 shares of stock and borrow $480. Strategy 4: Buy 40 shares of stock and borrow $280.(a) For each of strategies 2-4, describe the value of the investor’s portfolio at time 0,and at time T for each possible movement of the stock.(b) For each of strategies 2-4, does the investor have…arrow_forward
- Negate the following compound statement using De Morgans's laws.arrow_forwardNegate the following compound statement using De Morgans's laws.arrow_forwardQuestion 6: Negate the following compound statements, using De Morgan's laws. A) If Alberta was under water entirely then there should be no fossil of mammals.arrow_forward
- Negate the following compound statement using De Morgans's laws.arrow_forwardCharacterize (with proof) all connected graphs that contain no even cycles in terms oftheir blocks.arrow_forwardLet G be a connected graph that does not have P4 or C3 as an induced subgraph (i.e.,G is P4, C3 free). Prove that G is a complete bipartite grapharrow_forward
arrow_back_ios
SEE MORE QUESTIONS
arrow_forward_ios
Recommended textbooks for you
 Algebra: Structure And Method, Book 1AlgebraISBN:9780395977224Author:Richard G. Brown, Mary P. Dolciani, Robert H. Sorgenfrey, William L. ColePublisher:McDougal Littell
 Glencoe Algebra 1, Student Edition, 9780079039897...AlgebraISBN:9780079039897Author:CarterPublisher:McGraw Hill
 Holt Mcdougal Larson Pre-algebra: Student Edition...AlgebraISBN:9780547587776Author:HOLT MCDOUGALPublisher:HOLT MCDOUGAL
 Mathematics For Machine TechnologyAdvanced MathISBN:9781337798310Author:Peterson, John.Publisher:Cengage Learning,
Algebra: Structure And Method, Book 1
Algebra
ISBN:9780395977224
Author:Richard G. Brown, Mary P. Dolciani, Robert H. Sorgenfrey, William L. Cole
Publisher:McDougal Littell
Glencoe Algebra 1, Student Edition, 9780079039897...
Algebra
ISBN:9780079039897
Author:Carter
Publisher:McGraw Hill
Holt Mcdougal Larson Pre-algebra: Student Edition...
Algebra
ISBN:9780547587776
Author:HOLT MCDOUGAL
Publisher:HOLT MCDOUGAL
Mathematics For Machine Technology
Advanced Math
ISBN:9781337798310
Author:Peterson, John.
Publisher:Cengage Learning,
Hypothesis Testing using Confidence Interval Approach; Author: BUM2413 Applied Statistics UMP;https://www.youtube.com/watch?v=Hq1l3e9pLyY;License: Standard YouTube License, CC-BY
Hypothesis Testing - Difference of Two Means - Student's -Distribution & Normal Distribution; Author: The Organic Chemistry Tutor;https://www.youtube.com/watch?v=UcZwyzwWU7o;License: Standard Youtube License