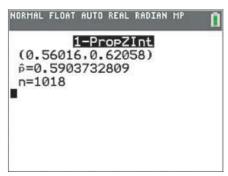
Environment A 2017 Gallup poll found that 601 out of 1018 randomly selected adults in the United States said protection of the environment should be given priority over development of U.S. energy supplies such as coal, oil, and gas. Assuming the conditions for using the CLT were met, use the TI calculator output provided to answer the following. a. Report a 95 % confidence interval for the population proportion. Write a sentence that explains what this interval means. b. Based on this interval, do you believe a majority of people in the United States believe protection of the environment should be given priority over development of U.S. energy supplies? Explain your reasoning.
Environment A 2017 Gallup poll found that 601 out of 1018 randomly selected adults in the United States said protection of the environment should be given priority over development of U.S. energy supplies such as coal, oil, and gas. Assuming the conditions for using the CLT were met, use the TI calculator output provided to answer the following. a. Report a 95 % confidence interval for the population proportion. Write a sentence that explains what this interval means. b. Based on this interval, do you believe a majority of people in the United States believe protection of the environment should be given priority over development of U.S. energy supplies? Explain your reasoning.
Solution Summary: The author analyzes the 95% confidence interval for the population proportion of U.S. adults who believe that environment protection should be prioritized over development of energy supplies.
Environment A 2017 Gallup poll found that 601 out of 1018 randomly selected adults in the United States said protection of the environment should be given priority over development of U.S. energy supplies such as coal, oil, and gas. Assuming the conditions for using the CLT were met, use the TI calculator output provided to answer the following.
a. Report a
95
%
confidence interval for the population proportion. Write a sentence that explains what this interval means.
b. Based on this interval, do you believe a majority of people in the United States believe protection of the environment should be given priority over development of U.S. energy supplies? Explain your reasoning.
Examine the Variables: Carefully review and note the names of all variables in the dataset. Examples of these variables include:
Mileage (mpg)
Number of Cylinders (cyl)
Displacement (disp)
Horsepower (hp)
Research: Google to understand these variables.
Statistical Analysis: Select mpg variable, and perform the following statistical tests. Once you are done with these tests using mpg variable, repeat the same with hp
Mean
Median
First Quartile (Q1)
Second Quartile (Q2)
Third Quartile (Q3)
Fourth Quartile (Q4)
10th Percentile
70th Percentile
Skewness
Kurtosis
Document Your Results:
In RStudio: Before running each statistical test, provide a heading in the format shown at the bottom. “# Mean of mileage – Your name’s command”
In Microsoft Word: Once you've completed all tests, take a screenshot of your results in RStudio and paste it into a Microsoft Word document. Make sure that snapshots are very clear. You will need multiple snapshots. Also transfer these results to the…
Need a deep-dive on the concept behind this application? Look no further. Learn more about this topic, statistics and related others by exploring similar questions and additional content below.


 Glencoe Algebra 1, Student Edition, 9780079039897...AlgebraISBN:9780079039897Author:CarterPublisher:McGraw Hill
 College Algebra (MindTap Course List)AlgebraISBN:9781305652231Author:R. David Gustafson, Jeff HughesPublisher:Cengage Learning
 Big Ideas Math A Bridge To Success Algebra 1: Stu...AlgebraISBN:9781680331141Author:HOUGHTON MIFFLIN HARCOURTPublisher:Houghton Mifflin Harcourt