
Concept explainers
Videos
Take your medicine: Medication used to treat a certain condition is administered by syringe. The target dose in a particular application is 10 milligrams. Because of the variations in the syringe, in reading the scale: and in mixing the fluid suspension, the actual dose administered is
- What is the
probability that the dose administered is between 9 and 11.5 milligrams? - Find the 98th percentile of the administered dose.
- If a clinical overdose is defined as a dose larger than 15 milligrams, what is the probability that a patient will receive an overdose?
(a)
To find: the probability that the dose administered is between
Answer to Problem 4RE
The required answer is
Explanation of Solution
Given Information:
A normal population has mean
standard deviation
Required Calculations:
It is asked in the question to find
Now,
Using normal table
Calculation:
To compute the proportion of the population that is between
1. Click CaIc, then select Probability distributions and then go to Normal.
2. Select the Cumulative option.
3. Enter
4. Enter
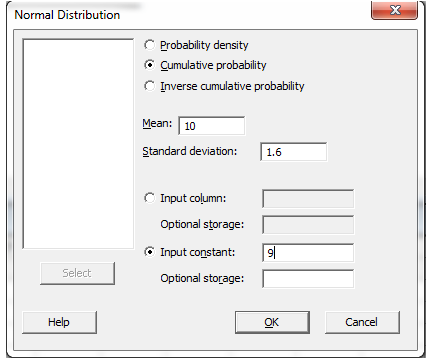
5. Click Ok. The final output is given below.
Cumulative Distribution function
Normal with mean
Similarly, compute the probability when
Cumulative distribution function.
Normal with mean
The required probability that
The required answer is
(b)
To find: the
Answer to Problem 4RE
The
Explanation of Solution
Given Information:
The actual dose administered is normally distributed with mean
standard deviation
Calculation:
To compute the
1. Click on Insert function.
2. Select NORMINV
3. Enter
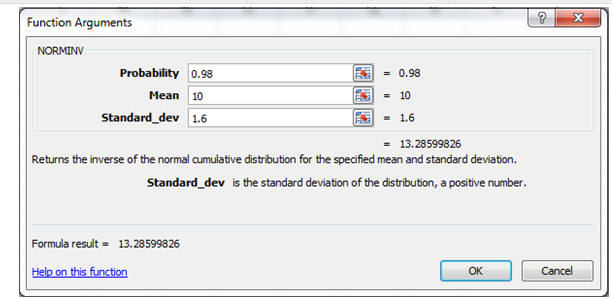
The above output shows that the
The required answer is
(C)
To compute: the probability that the dose administered is greater than
Answer to Problem 4RE
The probability that the dose administered is greater than
Explanation of Solution
Given Information:
A normal population has mean
standard deviation
Required calculations:
it is asked in the question to find
Using normal table
Calculation steps:
Compute the probability that the dose administered is greater than
Cumulative Distribution Function
Normal with mean
The required probability is,
The probability that the dose administered is greater than
Want to see more full solutions like this?
Chapter 7 Solutions
ELEMENTARY STATISTICS-ALEKS ACCESS CODE


- Examine the Variables: Carefully review and note the names of all variables in the dataset. Examples of these variables include: Mileage (mpg) Number of Cylinders (cyl) Displacement (disp) Horsepower (hp) Research: Google to understand these variables. Statistical Analysis: Select mpg variable, and perform the following statistical tests. Once you are done with these tests using mpg variable, repeat the same with hp Mean Median First Quartile (Q1) Second Quartile (Q2) Third Quartile (Q3) Fourth Quartile (Q4) 10th Percentile 70th Percentile Skewness Kurtosis Document Your Results: In RStudio: Before running each statistical test, provide a heading in the format shown at the bottom. “# Mean of mileage – Your name’s command” In Microsoft Word: Once you've completed all tests, take a screenshot of your results in RStudio and paste it into a Microsoft Word document. Make sure that snapshots are very clear. You will need multiple snapshots. Also transfer these results to the…arrow_forward2 (VaR and ES) Suppose X1 are independent. Prove that ~ Unif[-0.5, 0.5] and X2 VaRa (X1X2) < VaRa(X1) + VaRa (X2). ~ Unif[-0.5, 0.5]arrow_forward8 (Correlation and Diversification) Assume we have two stocks, A and B, show that a particular combination of the two stocks produce a risk-free portfolio when the correlation between the return of A and B is -1.arrow_forward
- 9 (Portfolio allocation) Suppose R₁ and R2 are returns of 2 assets and with expected return and variance respectively r₁ and 72 and variance-covariance σ2, 0%½ and σ12. Find −∞ ≤ w ≤ ∞ such that the portfolio wR₁ + (1 - w) R₂ has the smallest risk.arrow_forward7 (Multivariate random variable) Suppose X, €1, €2, €3 are IID N(0, 1) and Y2 Y₁ = 0.2 0.8X + €1, Y₂ = 0.3 +0.7X+ €2, Y3 = 0.2 + 0.9X + €3. = (In models like this, X is called the common factors of Y₁, Y₂, Y3.) Y = (Y1, Y2, Y3). (a) Find E(Y) and cov(Y). (b) What can you observe from cov(Y). Writearrow_forward1 (VaR and ES) Suppose X ~ f(x) with 1+x, if 0> x > −1 f(x) = 1−x if 1 x > 0 Find VaRo.05 (X) and ES0.05 (X).arrow_forward
- Joy is making Christmas gifts. She has 6 1/12 feet of yarn and will need 4 1/4 to complete our project. How much yarn will she have left over compute this solution in two different ways arrow_forwardSolve for X. Explain each step. 2^2x • 2^-4=8arrow_forwardOne hundred people were surveyed, and one question pertained to their educational background. The results of this question and their genders are given in the following table. Female (F) Male (F′) Total College degree (D) 30 20 50 No college degree (D′) 30 20 50 Total 60 40 100 If a person is selected at random from those surveyed, find the probability of each of the following events.1. The person is female or has a college degree. Answer: equation editor Equation Editor 2. The person is male or does not have a college degree. Answer: equation editor Equation Editor 3. The person is female or does not have a college degree.arrow_forward
 Big Ideas Math A Bridge To Success Algebra 1: Stu...AlgebraISBN:9781680331141Author:HOUGHTON MIFFLIN HARCOURTPublisher:Houghton Mifflin Harcourt
 Glencoe Algebra 1, Student Edition, 9780079039897...AlgebraISBN:9780079039897Author:CarterPublisher:McGraw Hill