
ELEMENTARY STATISTICS-ALEKS ACCESS CODE
3rd Edition
ISBN: 9781265787219
Author: Navidi
Publisher: MCG
expand_more
expand_more
format_list_bulleted
Question
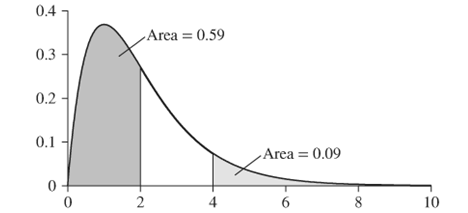
Chapter 7, Problem 1CQ
(a)
To determine
The proportion of population in between 2 and 4.
(a)
Expert Solution
Answer to Problem 1CQ
The proportion of population in between 2 to 4 is
Explanation of Solution
Given:
The probability density curve is,

Calculation:
The proportion of population in between 2 to 4 is calculated as follows:
Thus, the proportion of population in between 2 to 4 is
(b)
To determine
The proportion of population in greater than 2.
(b)
Expert Solution
Answer to Problem 1CQ
The proportion of population in greater than 2 is
Explanation of Solution
Given:
The probability density curve is,
Calculation:
The proportion of population in greater than 2 is calculated as follows:
Thus, the proportion of population in greater than 2 is
Want to see more full solutions like this?
Subscribe now to access step-by-step solutions to millions of textbook problems written by subject matter experts!
Students have asked these similar questions
Discuss and explain in the picture
Bob and Teresa each collect their own samples to test the same hypothesis. Bob’s p-value turns out to be 0.05, and Teresa’s turns out to be 0.01.
Why don’t Bob and Teresa get the same p-values?
Who has stronger evidence against the null hypothesis: Bob or Teresa?
Review a classmate's Main Post.
1. State if you agree or disagree with the choices made for additional analysis
that can be done beyond the frequency table.
2. Choose a measure of central tendency (mean, median, mode) that you
would like to compute with the data beyond the frequency table. Complete
either a or b below.
a. Explain how that analysis can help you understand the data better.
b. If you are currently unable to do that analysis, what do you think you
could do to make it possible? If you do not think you can do
anything, explain why it is not possible.
Chapter 7 Solutions
ELEMENTARY STATISTICS-ALEKS ACCESS CODE
Ch. 7.1 - In Exercises 9-14, fill in each blank with the...Ch. 7.1 - In Exercises 9-14, fill in each blank with the...Ch. 7.1 - In Exercises 9-14, fill in each blank with the...Ch. 7.1 - In Exercises 9-14, fill in each blank with the...Ch. 7.1 - In Exercises 9-14, fill in each blank with the...Ch. 7.1 - In Exercises 9-14, fill in each blank with the...Ch. 7.1 - Prob. 15ECh. 7.1 - In Exercises 15-18, determine whether the...Ch. 7.1 - In Exercises 15-18, determine whether the...Ch. 7.1 - In Exercises 15-18, determine whether the...
Ch. 7.1 - The following figure is a probability density...Ch. 7.1 - The following figure is a probability density...Ch. 7.1 - Find each of the shaded areas under the standard...Ch. 7.1 - Find each of the shaded areas under the standard...Ch. 7.1 - Find the area under the standard normal curve to...Ch. 7.1 - Find the area under the standard normal curve to...Ch. 7.1 - Find the area under the standard normal curve to...Ch. 7.1 - Find the area under the standard normal curve to...Ch. 7.1 - Find the area under the standard normal curve that...Ch. 7.1 - Find the area under the standard normal curve that...Ch. 7.1 - Find the area under the standard normal curve that...Ch. 7.1 - Find the area under the standard normal curve that...Ch. 7.1 - Find the z-score for which the area to its left is...Ch. 7.1 - Find the z-score for which the area to its left is...Ch. 7.1 - Find the z-score for which the area to its left is...Ch. 7.1 - Find the z-score for which the area to its left is...Ch. 7.1 - Find the z-score for which the area to its right...Ch. 7.1 - Find the z-score for which the area to its right...Ch. 7.1 - Find the z-score for which the area to its right...Ch. 7.1 - Find the z-score for which the area to its right...Ch. 7.1 - Find the z-scores that bound the middle 50% of the...Ch. 7.1 - Find the z-scores that bound the middle 70% of the...Ch. 7.1 - Find the z-scores that bound the middle 80% of the...Ch. 7.1 - Find the z-scores that bound the middle 98% of the...Ch. 7.1 - Symmetry: The area under the standard normal curve...Ch. 7.1 - Symmetry: The area under the standard normal curve...Ch. 7.1 - Symmetry: The area under the standard normal curve...Ch. 7.1 - Prob. 46ECh. 7.1 - Prob. 47ECh. 7.1 - Prob. 48ECh. 7.2 - In Exercises 9-10, fill in each blank with the...Ch. 7.2 - In Exercises 9-10, fill in each blank with the...Ch. 7.2 - Prob. 11ECh. 7.2 - Prob. 12ECh. 7.2 - Prob. 13ECh. 7.2 - Prob. 14ECh. 7.2 - Prob. 15ECh. 7.2 - Prob. 16ECh. 7.2 - A normal population has mean =20 and standard...Ch. 7.2 - A normal population has mean =9 and standard...Ch. 7.2 - A normal population has mean =25 and standard...Ch. 7.2 - A normal population has mean =61 and standard...Ch. 7.2 - A normal population has mean =47 and standard...Ch. 7.2 - A normal population has mean =35 and standard...Ch. 7.2 - A normal population has mean =12 and standard...Ch. 7.2 - A normal population has mean =56 and standard...Ch. 7.2 - A normal population has mean =46 and standard...Ch. 7.2 - A normal population has mean =71 and standard...Ch. 7.2 - Check your blood pressure: In a recent study, the...Ch. 7.2 - Baby weights: According to a recent National...Ch. 7.2 - Check your blood pressure: The Centers for Disease...Ch. 7.2 - Baby weights: The weight of male babies less than...Ch. 7.2 - Fish story: According to a report by the U.S. Fish...Ch. 7.2 - Big chickens: According to thepoultrysite.com: the...Ch. 7.2 - Fish story: The U.S. Fish and Wildlife Service...Ch. 7.2 - Big chickens: A report on thepoulttysite.com...Ch. 7.2 - Radon: Radon is a naturally occurring radioactive...Ch. 7.2 - Electric bills: According to the U.S. Energy...Ch. 7.2 - Radon: Assume that radon measurements are normally...Ch. 7.2 - Electric bills: The U.S. Energy Information Agency...Ch. 7.2 - Tire lifetimes: The lifetime of a certain type of...Ch. 7.2 - Tree heights: Cherry trees in a certain orchard...Ch. 7.2 - Tire lifetimes: The lifetime of a certain type of...Ch. 7.2 - Tree heights: Cherry trees in a certain orchard...Ch. 7.2 - How much is in that can? The volume of beverage in...Ch. 7.2 - How much do you study? A survey among freshmen at...Ch. 7.2 - How much is in that can? The volume of beverage in...Ch. 7.2 - How much do you study? A survey among freshmen at...Ch. 7.2 - Precision manufacturing: A process manufactures...Ch. 7.2 - Exam grades: Scores on a statistics final in a...Ch. 7.2 - Precision manufacturing: A process manufactures...Ch. 7.2 - Prob. 50ECh. 7.2 - Tall men: Heights of men in a certain city are...Ch. 7.2 - Watch your speed: Speeds of automobiles on a...Ch. 7.2 - Contaminated wells: A study reported that the mean...Ch. 7.2 - Prob. 54ECh. 7.2 - Exam scores: Scores on an exam were normally...Ch. 7.2 - Prob. 56ECh. 7.3 - In Exercises 5 and 6, fill in each blank with the...Ch. 7.3 - In Exercises 5 and 6, fill in each blank with the...Ch. 7.3 - In Exercises 7 and 8, determine whether the...Ch. 7.3 - In Exercises 7 and 8, determine whether the...Ch. 7.3 - A sample of size 75 will be drawn from a...Ch. 7.3 - A sample of size 126 will be drawn from a...Ch. 7.3 - A sample of size 68 will be drawn from a...Ch. 7.3 - A sample of size 284 will be drawn from a...Ch. 7.3 - A sample of size 91 will be drawn from a...Ch. 7.3 - Prob. 14ECh. 7.3 - A sample of sue 20 will be drawn from a population...Ch. 7.3 - A sample of size 42 will be drawn from a...Ch. 7.3 - A sample of size 5 will be drawn from a normal...Ch. 7.3 - A sample of size 15 will be drawn from a...Ch. 7.3 - Prob. 19ECh. 7.3 - Ages of winners: Following are the ages of the...Ch. 7.3 - Hows your mileage? The Environmental Protection...Ch. 7.3 - Watch your cholesterol: The National Health and...Ch. 7.3 - TV sets: A Nielsen Company report states that the...Ch. 7.3 - Prob. 24ECh. 7.3 - Taxes: The Internal Revenue Service reports that...Ch. 7.3 - High-rent district: The Real Estate Group NY...Ch. 7.3 - Roller coaster ride: A roller coaster is being...Ch. 7.3 - Elevator ride: Engineers are designing a large...Ch. 7.3 - Annual income: The mean annual income for people...Ch. 7.3 - Going to work: An ABC News report stated that the...Ch. 7.3 - Prob. 31ECh. 7.3 - Prob. 32ECh. 7.3 - Prob. 33ECh. 7.3 - Battery life: A battery manufacturer claims that...Ch. 7.3 - Prob. 35ECh. 7.4 - In Exercises 5 and 6, fill in each blank with the...Ch. 7.4 - Prob. 6ECh. 7.4 - In Exercises 7 and 8, determine whether the...Ch. 7.4 - Prob. 8ECh. 7.4 - In Exercises 9-14, n is the sample size, p is the...Ch. 7.4 - In Exercises 9-14, n is the sample size, p is the...Ch. 7.4 - In Exercises 9-14, n is the sample size, p is the...Ch. 7.4 - Prob. 12ECh. 7.4 - Prob. 13ECh. 7.4 - Prob. 14ECh. 7.4 - Coffee: The National Coffee Association reported...Ch. 7.4 - Smartphones: A Pew Research report indicated that...Ch. 7.4 - Student loans: The Institute for College Access...Ch. 7.4 - High school graduates: The National Center for...Ch. 7.4 - Government workers: The Bureau of Labor Statistics...Ch. 7.4 - Working two jobs: The Bureau of Labor Statistics...Ch. 7.4 - Future scientists: Education professionals refer...Ch. 7.4 - Blood pressure: High blood pressure has been...Ch. 7.4 - Pay your taxes: According to the Internal Revenue...Ch. 7.4 - Weekly paycheck: The Bureau of Labor Statistics...Ch. 7.4 - Kidney transplants: The Health Resources and...Ch. 7.4 - Hows your new car? The General Social Survey...Ch. 7.4 - How many boys? There are two hospitals m a town....Ch. 7.4 - Prob. 28ECh. 7.4 - Flawless tiles: A new process has been designed to...Ch. 7.5 - In Exercises 5 and 6, fill in each blank with the...Ch. 7.5 - Prob. 6ECh. 7.5 - Prob. 7ECh. 7.5 - Prob. 8ECh. 7.5 - Prob. 9ECh. 7.5 - Prob. 10ECh. 7.5 - Prob. 11ECh. 7.5 - Prob. 12ECh. 7.5 - Prob. 13ECh. 7.5 - Prob. 14ECh. 7.5 - Google it: According to a report of the Nielsen...Ch. 7.5 - Big babies: The Centers for Disease Control and...Ch. 7.5 - High blood pressure: The National Health and...Ch. 7.5 - Stress at work: In a poll conducted by the General...Ch. 7.5 - Prob. 19ECh. 7.5 - Gardening: A gardener buys a package of seeds....Ch. 7.5 - The car is in the shop: Among automobiles of a...Ch. 7.5 - Genetics: Pea plants contain two genes for seed...Ch. 7.5 - Prob. 23ECh. 7.5 - Prob. 24ECh. 7.5 - Prob. 25ECh. 7.6 - In Exercise 7, fill in each blank with the...Ch. 7.6 - Prob. 8ECh. 7.6 - Prob. 9ECh. 7.6 - Prob. 10ECh. 7.6 - Prob. 11ECh. 7.6 - Prob. 12ECh. 7.6 - Prob. 13ECh. 7.6 - The following histogram illustrates a sample. Is...Ch. 7.6 - Prob. 15ECh. 7.6 - Prob. 16ECh. 7.6 - Prob. 17ECh. 7.6 - Prob. 18ECh. 7.6 - Drug concentrations: A sample of 10 people...Ch. 7.6 - Reading scores: A random sample of eight...Ch. 7.6 - Prob. 21ECh. 7.6 - Impure cans: A manufacturer of aluminum cans...Ch. 7.6 - Prob. 23ECh. 7.6 - Prob. 24ECh. 7.6 - Prob. 25ECh. 7.6 - Prob. 26ECh. 7.6 - Prob. 27ECh. 7.6 - Prob. 28ECh. 7.6 - Prob. 29ECh. 7.6 - Prob. 30ECh. 7.6 - Prob. 31ECh. 7.6 - Prob. 32ECh. 7 - Prob. 1CQCh. 7 - Find the area under the standard normal curve To...Ch. 7 - Find the z-score that has An area of 0.33 to its...Ch. 7 - Find the z-scores that bound the middle 80% of the...Ch. 7 - Find z0.15.Ch. 7 - Suppose that salaries of recent graduates from a...Ch. 7 - A normal population has mean =242 and standard...Ch. 7 - Suppose that in a bowling league, the scores among...Ch. 7 - State the Central Limit Theorem.Ch. 7 - A population has mean =193 and standard deviation...Ch. 7 - The running time for videos submitted to YouTube...Ch. 7 - A sample of size n=55 is drawn from a population...Ch. 7 - Prob. 13CQCh. 7 - Prob. 14CQCh. 7 - Prob. 15CQCh. 7 - Find the area: Find the area under the standard...Ch. 7 - Find the z-score: Find the z-score for which the...Ch. 7 - Your battery is dead: The lifetimes of a certain...Ch. 7 - Take your medicine: Medication used to treat a...Ch. 7 - Lightbulbs: The lifetime of lightbulbs has a mean...Ch. 7 - Prob. 6RECh. 7 - Pay your taxes: Among all the state income tax...Ch. 7 - Prob. 8RECh. 7 - Prob. 9RECh. 7 - Facebook: Eighty percent of the students at a...Ch. 7 - Prob. 11RECh. 7 - Prob. 12RECh. 7 - Prob. 13RECh. 7 - Prob. 14RECh. 7 - Prob. 15RECh. 7 - Explain why P(aXb) is equal to P(aXb) when X is a...Ch. 7 - Prob. 2WAICh. 7 - Prob. 3WAICh. 7 - Suppose that in a large class, the instructor...Ch. 7 - Prob. 5WAICh. 7 - Prob. 6WAICh. 7 - Prob. 7WAICh. 7 - Compute the sample mean x and the sample standard...Ch. 7 - Estimate the population mean g with X and the...Ch. 7 - The shipment will be accepted if we estimate that...Ch. 7 - A second shipment of cans is received. Ten...Ch. 7 - Compute the sample mean x and the sample standard...Ch. 7 - Using the same method as for the first sample,...Ch. 7 - The shipment will be accepted if we estimate that...Ch. 7 - Make a boxplot of the pressures for the second...
Knowledge Booster

Similar questions
- 0|0|0|0 - Consider the time series X₁ and Y₁ = (I – B)² (I – B³)Xt. What transformations were performed on Xt to obtain Yt? seasonal difference of order 2 simple difference of order 5 seasonal difference of order 1 seasonal difference of order 5 simple difference of order 2arrow_forwardCalculate the 90% confidence interval for the population mean difference using the data in the attached image. I need to see where I went wrong.arrow_forwardMicrosoft Excel snapshot for random sampling: Also note the formula used for the last column 02 x✓ fx =INDEX(5852:58551, RANK(C2, $C$2:$C$51)) A B 1 No. States 2 1 ALABAMA Rand No. 0.925957526 3 2 ALASKA 0.372999976 4 3 ARIZONA 0.941323044 5 4 ARKANSAS 0.071266381 Random Sample CALIFORNIA NORTH CAROLINA ARKANSAS WASHINGTON G7 Microsoft Excel snapshot for systematic sampling: xfx INDEX(SD52:50551, F7) A B E F G 1 No. States Rand No. Random Sample population 50 2 1 ALABAMA 0.5296685 NEW HAMPSHIRE sample 10 3 2 ALASKA 0.4493186 OKLAHOMA k 5 4 3 ARIZONA 0.707914 KANSAS 5 4 ARKANSAS 0.4831379 NORTH DAKOTA 6 5 CALIFORNIA 0.7277162 INDIANA Random Sample Sample Name 7 6 COLORADO 0.5865002 MISSISSIPPI 8 7:ONNECTICU 0.7640596 ILLINOIS 9 8 DELAWARE 0.5783029 MISSOURI 525 10 15 INDIANA MARYLAND COLORADOarrow_forward
- Suppose the Internal Revenue Service reported that the mean tax refund for the year 2022 was $3401. Assume the standard deviation is $82.5 and that the amounts refunded follow a normal probability distribution. Solve the following three parts? (For the answer to question 14, 15, and 16, start with making a bell curve. Identify on the bell curve where is mean, X, and area(s) to be determined. 1.What percent of the refunds are more than $3,500? 2. What percent of the refunds are more than $3500 but less than $3579? 3. What percent of the refunds are more than $3325 but less than $3579?arrow_forwardA normal distribution has a mean of 50 and a standard deviation of 4. Solve the following three parts? 1. Compute the probability of a value between 44.0 and 55.0. (The question requires finding probability value between 44 and 55. Solve it in 3 steps. In the first step, use the above formula and x = 44, calculate probability value. In the second step repeat the first step with the only difference that x=55. In the third step, subtract the answer of the first part from the answer of the second part.) 2. Compute the probability of a value greater than 55.0. Use the same formula, x=55 and subtract the answer from 1. 3. Compute the probability of a value between 52.0 and 55.0. (The question requires finding probability value between 52 and 55. Solve it in 3 steps. In the first step, use the above formula and x = 52, calculate probability value. In the second step repeat the first step with the only difference that x=55. In the third step, subtract the answer of the first part from the…arrow_forwardIf a uniform distribution is defined over the interval from 6 to 10, then answer the followings: What is the mean of this uniform distribution? Show that the probability of any value between 6 and 10 is equal to 1.0 Find the probability of a value more than 7. Find the probability of a value between 7 and 9. The closing price of Schnur Sporting Goods Inc. common stock is uniformly distributed between $20 and $30 per share. What is the probability that the stock price will be: More than $27? Less than or equal to $24? The April rainfall in Flagstaff, Arizona, follows a uniform distribution between 0.5 and 3.00 inches. What is the mean amount of rainfall for the month? What is the probability of less than an inch of rain for the month? What is the probability of exactly 1.00 inch of rain? What is the probability of more than 1.50 inches of rain for the month? The best way to solve this problem is begin by a step by step creating a chart. Clearly mark the range, identifying the…arrow_forward
- Client 1 Weight before diet (pounds) Weight after diet (pounds) 128 120 2 131 123 3 140 141 4 178 170 5 121 118 6 136 136 7 118 121 8 136 127arrow_forwardClient 1 Weight before diet (pounds) Weight after diet (pounds) 128 120 2 131 123 3 140 141 4 178 170 5 121 118 6 136 136 7 118 121 8 136 127 a) Determine the mean change in patient weight from before to after the diet (after – before). What is the 95% confidence interval of this mean difference?arrow_forwardIn order to find probability, you can use this formula in Microsoft Excel: The best way to understand and solve these problems is by first drawing a bell curve and marking key points such as x, the mean, and the areas of interest. Once marked on the bell curve, figure out what calculations are needed to find the area of interest. =NORM.DIST(x, Mean, Standard Dev., TRUE). When the question mentions “greater than” you may have to subtract your answer from 1. When the question mentions “between (two values)”, you need to do separate calculation for both values and then subtract their results to get the answer. 1. Compute the probability of a value between 44.0 and 55.0. (The question requires finding probability value between 44 and 55. Solve it in 3 steps. In the first step, use the above formula and x = 44, calculate probability value. In the second step repeat the first step with the only difference that x=55. In the third step, subtract the answer of the first part from the…arrow_forward
- If a uniform distribution is defined over the interval from 6 to 10, then answer the followings: What is the mean of this uniform distribution? Show that the probability of any value between 6 and 10 is equal to 1.0 Find the probability of a value more than 7. Find the probability of a value between 7 and 9. The closing price of Schnur Sporting Goods Inc. common stock is uniformly distributed between $20 and $30 per share. What is the probability that the stock price will be: More than $27? Less than or equal to $24? The April rainfall in Flagstaff, Arizona, follows a uniform distribution between 0.5 and 3.00 inches. What is the mean amount of rainfall for the month? What is the probability of less than an inch of rain for the month? What is the probability of exactly 1.00 inch of rain? What is the probability of more than 1.50 inches of rain for the month? The best way to solve this problem is begin by creating a chart. Clearly mark the range, identifying the lower and upper…arrow_forwardProblem 1: The mean hourly pay of an American Airlines flight attendant is normally distributed with a mean of 40 per hour and a standard deviation of 3.00 per hour. What is the probability that the hourly pay of a randomly selected flight attendant is: Between the mean and $45 per hour? More than $45 per hour? Less than $32 per hour? Problem 2: The mean of a normal probability distribution is 400 pounds. The standard deviation is 10 pounds. What is the area between 415 pounds and the mean of 400 pounds? What is the area between the mean and 395 pounds? What is the probability of randomly selecting a value less than 395 pounds? Problem 3: In New York State, the mean salary for high school teachers in 2022 was 81,410 with a standard deviation of 9,500. Only Alaska’s mean salary was higher. Assume New York’s state salaries follow a normal distribution. What percent of New York State high school teachers earn between 70,000 and 75,000? What percent of New York State high school…arrow_forwardPls help asaparrow_forward
arrow_back_ios
SEE MORE QUESTIONS
arrow_forward_ios
Recommended textbooks for you
 Holt Mcdougal Larson Pre-algebra: Student Edition...AlgebraISBN:9780547587776Author:HOLT MCDOUGALPublisher:HOLT MCDOUGAL
 Algebra & Trigonometry with Analytic GeometryAlgebraISBN:9781133382119Author:SwokowskiPublisher:Cengage
 College Algebra (MindTap Course List)AlgebraISBN:9781305652231Author:R. David Gustafson, Jeff HughesPublisher:Cengage Learning
 Algebra and Trigonometry (MindTap Course List)AlgebraISBN:9781305071742Author:James Stewart, Lothar Redlin, Saleem WatsonPublisher:Cengage Learning
 Glencoe Algebra 1, Student Edition, 9780079039897...AlgebraISBN:9780079039897Author:CarterPublisher:McGraw Hill
Holt Mcdougal Larson Pre-algebra: Student Edition...
Algebra
ISBN:9780547587776
Author:HOLT MCDOUGAL
Publisher:HOLT MCDOUGAL
Algebra & Trigonometry with Analytic Geometry
Algebra
ISBN:9781133382119
Author:Swokowski
Publisher:Cengage
College Algebra (MindTap Course List)
Algebra
ISBN:9781305652231
Author:R. David Gustafson, Jeff Hughes
Publisher:Cengage Learning
Algebra and Trigonometry (MindTap Course List)
Algebra
ISBN:9781305071742
Author:James Stewart, Lothar Redlin, Saleem Watson
Publisher:Cengage Learning
Glencoe Algebra 1, Student Edition, 9780079039897...
Algebra
ISBN:9780079039897
Author:Carter
Publisher:McGraw Hill