
Videos
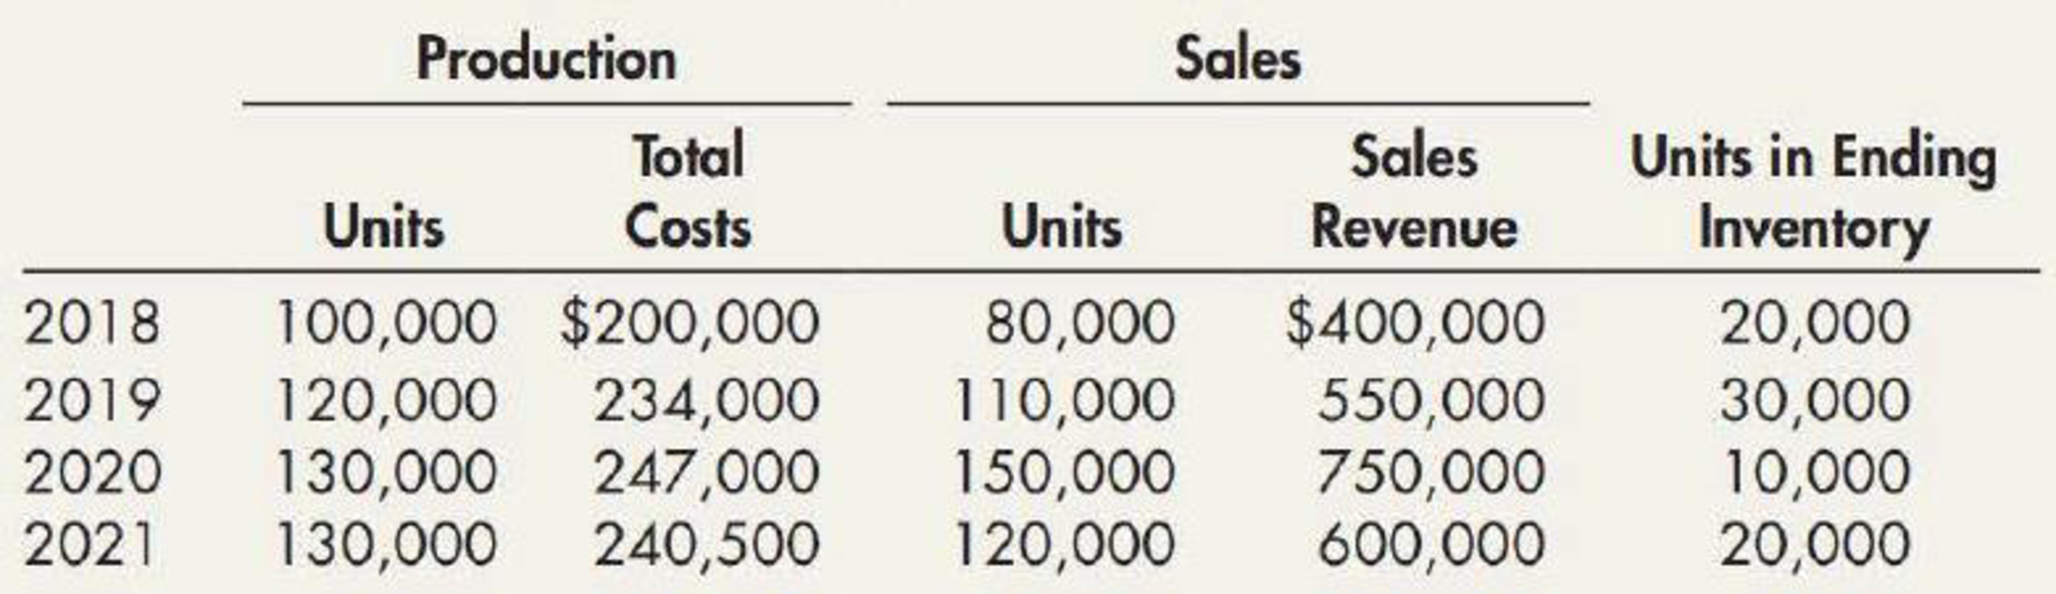
Habicht Company was formed in 2018 to produce a single product. The production and sales for the next 4 years were as follows:
Required:
- 1. Determine the gross profit for each year under each of the following periodic inventory methods:
- a. FIFO
- b. LIFO
- c. Average cost (Round unit costs to 3 decimal places.)
- 2. Next Level Explain whether the company’s return on assets (net income divided by average total assets) would be higher under FIFO or LIFO.
1.
Ascertain the gross profit under the periodic inventory system for each year as per the inventory cashflow methods.
Explanation of Solution
First-in-First-Out (FIFO): In this method, items purchased initially are sold first. So, the value of the ending inventory consists the recent cost for the remaining unsold items.
Last-in-First-Out (LIFO): In this method, items purchased recently are sold first. So, the value of the ending inventory consists the initial cost for the remaining unsold items.
- a) Calculate the gross profit for the four years under FIFO method:
| Particulars | 2018 | 2019 | 2020 | 2021 |
| Amount ($) | Amount ($) | Amount ($) | Amount ($) | |
| Net sales | $400,000 | $550,000 | $750,000 | $600,000 |
| Cost of goods sold | ||||
| Beginning inventory | $ 0 | $ 40,000 | $ 58,500 | $ 19,000 |
| Add: Production | $ 200,000 | $ 234,000 | $ 247,000 | $ 240,500 |
| Goods available for sale | $ 200,000 | $ 274,000 | $ 305,500 | $ 259,500 |
| Less: Ending inventory | (1) $ 40,000 | (2) $ 58,500 | (3) $ 19,000 | (4) $ 37,000 |
| Cost of goods sold | $ 160,000 | $ 215,500 | $ 286,500 | $ 222,500 |
| Gross Margin | $ 240,000 | $ 334,500 | $ 463,500 | $ 377,500 |
Table (1)
Working Note (1):
Ending inventory for 2018 is $40,000
Working Note (2):
Ending inventory for 2019 is $58,500
Working Note (3):
Ending inventory for 2020 is $19,000
Working Note (4):
Ending inventory for 2021 is $37,000
- b) Calculate the gross profit for the four years under LIFO method:
| Particulars | 2018 | 2019 | 2020 | 2021 |
| Amount ($) | Amount ($) | Amount ($) | Amount ($) | |
| Net sales | $400,000 | $550,000 | $750,000 | $600,000 |
| Cost of goods sold | ||||
| Beginning inventory | $ 0 | $ 40,000 | $ 59,500 | $ 20,000 |
| Add: Production | $ 200,000 | $ 234,000 | $ 247,000 | $ 240,500 |
| Goods available for sale | $ 200,000 | $ 274,000 | $ 306,500 | $ 260,500 |
| Less: Ending inventory | (5) $ 40,000 | (6) $ 59,500 | (7) $ 20,000 | (8) $ 38,500 |
| Cost of goods sold | $ 160,000 | $ 214,500 | $ 286,500 | $ 222,000 |
| Gross Margin | $ 240,000 | $ 335,500 | $ 463,500 | $ 378,000 |
Table (2)
Working Note (5):
Ending inventory for 2018 is $40,000
Working Note (6):
Ending inventory for 2019 is $59,500
Working Note (7):
Ending inventory for 2020 is $20,000
Working Note (8):
Ending inventory for 2021 is $38,500
- a) Calculate the gross profit for the four years under Average cost method:
Compute the cost of goods sold for average cost method:
| Year | Beginning inventory | Production | Goods available for sale | Average Unit | |||
| Units | Cost | Units | Cost | Units | Cost | Cost | |
| 2018 | 0 | $ 0 | 100,000 | $ 200,000 | 100,000 | $ 200,000 | $ 2.00 |
| 2019 | 20,000 | $ 40,000 | 120,000 | $ 234,000 | 140,000 | $ 274,000 | $ 1.957 |
| 2020 | 30,000 | $ 58,710 | 130,000 | $ 247,000 | 160,000 | $ 305,710 | $ 1.911 |
| 2021 | 10,000 | $ 19,110 | 130,000 | $ 240,500 | 140,000 | $ 259,610 | $ 1.854 |
Table (3)
| Year | Ending inventory | Cost of goods sold | ||
| Units | Cost | Units | Cost | |
| 2018 | 20,000 | $ 40,000 | 80,000 | $ 160,000 |
| 2019 | 30,000 | $ 58,710 | 110,000 | $ 215,290 |
| 2020 | 10,000 | $ 19,110 | 150,000 | $ 286,600 |
| 2021 | 20,000 | $ 37,080 | 120,000 | $ 222,530 |
Table (4)
Calculate the gross profit for the four years under Average cost method
| Particulars | 2018 | 2019 | 2020 | 2021 |
| Amount ($) | Amount ($) | Amount ($) | Amount ($) | |
| Net sales | $400,000 | $550,000 | $750,000 | $600,000 |
| Cost of goods sold | ||||
| Beginning inventory | $ 0 | $ 40,000 | $ 58,710 | $ 19,110 |
| Add: Production | $ 200,000 | $ 234,000 | $ 247,000 | $ 240,500 |
| Goods available for sale | $ 200,000 | $ 274,000 | $ 305,710 | $ 259,610 |
| Less: Ending inventory | $ 40,000 | $ 58,710 | $ 19,110 | $ 37,080 |
| Cost of goods sold | $ 160,000 | $ 215,290 | $ 286,600 | $ 222,530 |
| Gross Margin | $ 240,000 | $ 334,710 | $ 463,400 | $ 377,470 |
Table (5)
2.
Identify would return on asset would be greater under FIFO and LIFO.
Explanation of Solution
The net income and assets are higher under the FIFO method. There is a difference in the net income under both the methods.
Want to see more full solutions like this?
Chapter 7 Solutions
Intermediate Accounting: Reporting And Analysis


- Intermediate Accounting: Reporting And AnalysisAccountingISBN:9781337788281Author:James M. Wahlen, Jefferson P. Jones, Donald PagachPublisher:Cengage Learning
 Managerial Accounting: The Cornerstone of Busines...AccountingISBN:9781337115773Author:Maryanne M. Mowen, Don R. Hansen, Dan L. HeitgerPublisher:Cengage Learning
 Principles of Accounting Volume 1AccountingISBN:9781947172685Author:OpenStaxPublisher:OpenStax College
  Financial Reporting, Financial Statement Analysis...FinanceISBN:9781285190907Author:James M. Wahlen, Stephen P. Baginski, Mark BradshawPublisher:Cengage Learning