
Statistical Reasoning for Everyday Life (5th Edition)
5th Edition
ISBN: 9780134494043
Author: Jeff Bennett, William L. Briggs, Mario F. Triola
Publisher: PEARSON
expand_more
expand_more
format_list_bulleted
Concept explainers
Videos
Textbook Question
Chapter 6.4, Problem 10E
Commercial Aviation. For Exercises 9–12, use the following table, which summarizes some data on commercial aviation flights in the United States for three separate years.
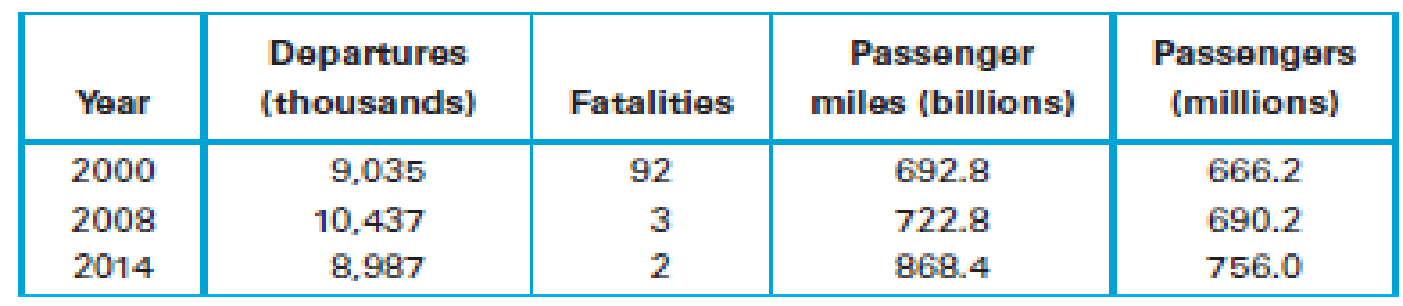
- 10. For each of the three years, find the fatality rate in deaths per billion passenger miles. On the basis of those rates, which year was the safest? Why?
Expert Solution & Answer
Want to see the full answer?
Check out a sample textbook solution
Students have asked these similar questions
Une Entreprise œuvrant dans le domaine du multividéo donne l'opportunité à ses
programmeurs-analystes d'évaluer la performance des cadres supérieurs.
Voici les résultats obtenues (sur une échelle de 10 à 50) où 50 représentent une
excellente performance. 10 programmeurs furent sélectionnés au hazard pour
évaluer deux cadres. Un rapport Excel est également fourni.
Programmeurs
Cadre A Cadre B
1
34
36
2
32
34
3
18
19
33
38
19
21
21
23
7
35
34
8
20
20
9
34
34
10
36
34
Test d'égalité des espérances: observations pairées
A television news channel samples 25 gas stations from its local area and uses the results to estimate the average gas price for the state. What’s wrong with its margin of error?
You’re fed up with keeping Fido locked inside, so you conduct a mail survey to find out people’s opinions on the new dog barking ordinance in a certain city. Of the 10,000 people who receive surveys, 1,000 respond, and only 80 are in favor of it. You calculate the margin of error to be 1.2 percent. Explain why this reported margin of error is misleading.
Chapter 6 Solutions
Statistical Reasoning for Everyday Life (5th Edition)
Ch. 6.1 - Coin Tossing. Suppose you toss a coin 100 times....Ch. 6.1 - Statistical Significance. What do we mean when we...Ch. 6.1 - Prob. 3ECh. 6.1 - Quantifying Significance. What does it mean to say...Ch. 6.1 - Does It Make Sense? For Exercises 58, determine...Ch. 6.1 - Does It Make Sense? For Exercises 58, determine...Ch. 6.1 - Does It Make Sense? For Exercises 58, determine...Ch. 6.1 - Does It Make Sense? For Exercises 58, determine...Ch. 6.1 - Subjective Significance. For each event in...Ch. 6.1 - Subjective Significance. For each event in...
Ch. 6.1 - Subjective Significance. For each event in...Ch. 6.1 - Subjective Significance. For each event in...Ch. 6.1 - Subjective Significance. For each event in...Ch. 6.1 - Subjective Significance. For each event in...Ch. 6.1 - Subjective Significance. For each event in...Ch. 6.1 - Subjective Significance. For each event in...Ch. 6.1 - Prob. 17ECh. 6.1 - Carpal Tunnel Syndrome Treatments. An experiment...Ch. 6.1 - Prob. 19ECh. 6.1 - Prob. 20ECh. 6.1 - Human Body Temperature. In a study by researchers...Ch. 6.1 - Seat Belts and Children. In a study of children...Ch. 6.1 - Prob. 23ECh. 6.1 - Subjective Significance. For each event in...Ch. 6.2 - Outcomes and Events. Distinguish between an...Ch. 6.2 - Notation. What does it mean when we write P(A)?...Ch. 6.2 - Probability Types. Briefly describe the...Ch. 6.2 - Prob. 4ECh. 6.2 - Prob. 5ECh. 6.2 - Does It Make Sense? For Exercises 58, determine...Ch. 6.2 - Prob. 7ECh. 6.2 - Does It Make Sense? For Exercises 58, determine...Ch. 6.2 - Counting Outcomes. How many different three-child...Ch. 6.2 - Prob. 10ECh. 6.2 - Theoretical Probabilities. For Exercises 1120, use...Ch. 6.2 - Theoretical Probabilities. For Exercises 1120, use...Ch. 6.2 - Theoretical Probabilities. For Exercises 1120, use...Ch. 6.2 - Theoretical Probabilities. For Exercises 1120, use...Ch. 6.2 - Theoretical Probabilities. For Exercises 1120, use...Ch. 6.2 - Theoretical Probabilities. For Exercises 1120, use...Ch. 6.2 - Theoretical Probabilities. For Exercises 1120, use...Ch. 6.2 - Theoretical Probabilities. For Exercises 1120, use...Ch. 6.2 - Theoretical Probabilities. For Exercises 1120, use...Ch. 6.2 - Theoretical Probabilities. For Exercises 1120, use...Ch. 6.2 - Days of the Week. What is the probability of...Ch. 6.2 - Days of the Week. What is the probability of...Ch. 6.2 - Complementary Events. Exercises 2330 involve...Ch. 6.2 - Complementary Events. Exercises 2330 involve...Ch. 6.2 - Complementary Events. Exercises 2330 involve...Ch. 6.2 - Complementary Events. Exercises 2330 involve...Ch. 6.2 - Complementary Events. Exercises 2330 involve...Ch. 6.2 - Complementary Events. Exercises 2330 involve...Ch. 6.2 - Prob. 29ECh. 6.2 - Prob. 30ECh. 6.2 - Theoretical Probabilities. For Exercises 3134, use...Ch. 6.2 - Theoretical Probabilities. For Exercises 3134, use...Ch. 6.2 - Theoretical Probabilities. For Exercises 3134, use...Ch. 6.2 - Theoretical Probabilities. For Exercises 3134, use...Ch. 6.2 - Relative Frequency Probabilities. Use the relative...Ch. 6.2 - Relative Frequency Probabilities. Use the relative...Ch. 6.2 - Relative Frequency Probabilities. Use the relative...Ch. 6.2 - Prob. 38ECh. 6.2 - Probability Distributions. In Exercises 39 and 40,...Ch. 6.2 - Probability Distributions. In Exercises 39 and 40,...Ch. 6.3 - Law of Large Numbers. What is the law of large...Ch. 6.3 - Understanding the Law of Large Numbers. In terms...Ch. 6.3 - Expected Value. What is an expected value, and how...Ch. 6.3 - Gamblers Fallacy. What is the gamblers fallacy?...Ch. 6.3 - Prob. 5ECh. 6.3 - Does It Make Sense? For Exercises 58, determine...Ch. 6.3 - Prob. 7ECh. 6.3 - Does It Make Sense? For Exercises 58, determine...Ch. 6.3 - Gender Selection. In analyzing genders of...Ch. 6.3 - Speedy Driver. A person who has a habit of driving...Ch. 6.3 - Should You Play? Suppose you are offered this...Ch. 6.3 - Kentuckys Pick 4 Lottery. If you bet 1 in...Ch. 6.3 - Expected Value for Life Insurance. There is a...Ch. 6.3 - Expected Value for Life Insurance There is a...Ch. 6.3 - Expected Waiting Time. You arrive at a bus stop...Ch. 6.3 - Expected Value in Roulette. As shown in Figure...Ch. 6.3 - Expected Value in Casino Dice. When you give a...Ch. 6.3 - New Jersey Pick 4. In New Jerseys Pick 4 lottery,...Ch. 6.3 - Extra Points in Football. Football teams have the...Ch. 6.3 - Prob. 20ECh. 6.3 - Psychology of Expected Values. In 1953, a French...Ch. 6.3 - Behind in Coin Tossing: Can You Catch Up? Suppose...Ch. 6.4 - Risk and Travel. What is travel risk? Give an...Ch. 6.4 - Prob. 2ECh. 6.4 - Prob. 3ECh. 6.4 - Prob. 4ECh. 6.4 - Prob. 5ECh. 6.4 - Does It Make Sense? For Exercises 58, determine...Ch. 6.4 - Prob. 7ECh. 6.4 - Prob. 8ECh. 6.4 - Prob. 9ECh. 6.4 - Commercial Aviation. For Exercises 912, use the...Ch. 6.4 - Commercial Aviation. For Exercises 912, use the...Ch. 6.4 - Prob. 12ECh. 6.4 - Births/Deaths. For Exercises 1316, use the data in...Ch. 6.4 - Births/Deaths. For Exercises 1316, use the data in...Ch. 6.4 - Births/Deaths. For Exercises 1316, use the data in...Ch. 6.4 - Births/Deaths. For Exercises 1316, use the data in...Ch. 6.4 - Vital Statistics. For Exercises 1720, use the data...Ch. 6.4 - Vital Statistics. For Exercises 1720, use the data...Ch. 6.4 - Prob. 19ECh. 6.4 - Prob. 20ECh. 6.4 - Prob. 21ECh. 6.4 - Prob. 22ECh. 6.4 - Prob. 23ECh. 6.4 - Prob. 24ECh. 6.4 - Prob. 25ECh. 6.4 - Prob. 26ECh. 6.4 - Prob. 27ECh. 6.4 - Prob. 28ECh. 6.4 - Life in This Century. Example 5 assumed that the...Ch. 6.4 - Prob. 30ECh. 6.5 - Independence. Let A denote the event of getting a...Ch. 6.5 - Independence. A geneticist is working with 3 green...Ch. 6.5 - Prob. 3ECh. 6.5 - Complementary Events. Let A be the event of...Ch. 6.5 - Prob. 5ECh. 6.5 - Does It Make Sense? For Exercises 58, determine...Ch. 6.5 - Does It Make Sense? For Exercises 58, determine...Ch. 6.5 - Does It Make Sense? For Exercises 58, determine...Ch. 6.5 - Births. Assume that boys and girls are equally...Ch. 6.5 - Births. A couple plans to have four children. Find...Ch. 6.5 - Password. A programmer is instructed to create a...Ch. 6.5 - Wearing Hunter Orange. A study of hunting injuries...Ch. 6.5 - Songs. The 50 songs on a smartphone consist of 15...Ch. 6.5 - Polls. A pollster plans to call adults. She has a...Ch. 6.5 - Probability and Court Decisions. In Exercises...Ch. 6.5 - Probability and Court Decisions. In Exercises...Ch. 6.5 - Probability and Court Decisions. In Exercises...Ch. 6.5 - Probability and Court Decisions. In Exercises...Ch. 6.5 - Probability and Court Decisions. In Exercises...Ch. 6.5 - Probability and Court Decisions. In Exercises...Ch. 6.5 - Prob. 21ECh. 6.5 - Pedestrian Deaths. For Exercises 2126, use the...Ch. 6.5 - Prob. 23ECh. 6.5 - Pedestrian Deaths. For Exercises 2126, use the...Ch. 6.5 - Prob. 25ECh. 6.5 - Pedestrian Deaths. For Exercises 2126, use the...Ch. 6.5 - Clinical Trial. In a clinical trial of an allergy...Ch. 6.5 - Prob. 28ECh. 6.5 - Prob. 29ECh. 6.5 - Survey Refusals. Refer to the data in Exercise 29....Ch. 6.5 - Drug Testing. A 1-Panel-THC test for marijuana use...Ch. 6.5 - BINGO. The game of BINGO involves drawing numbered...Ch. 6 - For Exercises 17, use the data in the following...Ch. 6 - For Exercises 17, use the data in the following...Ch. 6 - For Exercises 17, use the data in the following...Ch. 6 - For Exercises 17, use the data in the following...Ch. 6 - For Exercises 17, use the data in the following...Ch. 6 - For Exercises 17, use the data in the following...Ch. 6 - For Exercises 17, use the data in the following...Ch. 6 - The Binary Computer Company manufactures computer...Ch. 6 - For a recent year, the fatality rate from motor...Ch. 6 - A Las Vegas handicapper can correctly predict the...Ch. 6 - For the handicapper in Exercise 1, find the...Ch. 6 - In a clinical trial of the effectiveness of a...Ch. 6 - If P(A) = 0.65, what is the value of P(not A)?Ch. 6 - In Exercises 610, use the following results. The...Ch. 6 - In Exercises 610, use the following results. The...Ch. 6 - Prob. 8CQCh. 6 - In Exercises 610, use the following results. The...Ch. 6 - In Exercises 610, use the following results. The...
Knowledge Booster


Learn more about
Need a deep-dive on the concept behind this application? Look no further. Learn more about this topic, statistics and related others by exploring similar questions and additional content below.Similar questions
- You find out that the dietary scale you use each day is off by a factor of 2 ounces (over — at least that’s what you say!). The margin of error for your scale was plus or minus 0.5 ounces before you found this out. What’s the margin of error now?arrow_forwardSuppose that Sue and Bill each make a confidence interval out of the same data set, but Sue wants a confidence level of 80 percent compared to Bill’s 90 percent. How do their margins of error compare?arrow_forwardSuppose that you conduct a study twice, and the second time you use four times as many people as you did the first time. How does the change affect your margin of error? (Assume the other components remain constant.)arrow_forward
- Out of a sample of 200 babysitters, 70 percent are girls, and 30 percent are guys. What’s the margin of error for the percentage of female babysitters? Assume 95 percent confidence.What’s the margin of error for the percentage of male babysitters? Assume 95 percent confidence.arrow_forwardYou sample 100 fish in Pond A at the fish hatchery and find that they average 5.5 inches with a standard deviation of 1 inch. Your sample of 100 fish from Pond B has the same mean, but the standard deviation is 2 inches. How do the margins of error compare? (Assume the confidence levels are the same.)arrow_forwardA survey of 1,000 dental patients produces 450 people who floss their teeth adequately. What’s the margin of error for this result? Assume 90 percent confidence.arrow_forward
- The annual aggregate claim amount of an insurer follows a compound Poisson distribution with parameter 1,000. Individual claim amounts follow a Gamma distribution with shape parameter a = 750 and rate parameter λ = 0.25. 1. Generate 20,000 simulated aggregate claim values for the insurer, using a random number generator seed of 955.Display the first five simulated claim values in your answer script using the R function head(). 2. Plot the empirical density function of the simulated aggregate claim values from Question 1, setting the x-axis range from 2,600,000 to 3,300,000 and the y-axis range from 0 to 0.0000045. 3. Suggest a suitable distribution, including its parameters, that approximates the simulated aggregate claim values from Question 1. 4. Generate 20,000 values from your suggested distribution in Question 3 using a random number generator seed of 955. Use the R function head() to display the first five generated values in your answer script. 5. Plot the empirical density…arrow_forwardFind binomial probability if: x = 8, n = 10, p = 0.7 x= 3, n=5, p = 0.3 x = 4, n=7, p = 0.6 Quality Control: A factory produces light bulbs with a 2% defect rate. If a random sample of 20 bulbs is tested, what is the probability that exactly 2 bulbs are defective? (hint: p=2% or 0.02; x =2, n=20; use the same logic for the following problems) Marketing Campaign: A marketing company sends out 1,000 promotional emails. The probability of any email being opened is 0.15. What is the probability that exactly 150 emails will be opened? (hint: total emails or n=1000, x =150) Customer Satisfaction: A survey shows that 70% of customers are satisfied with a new product. Out of 10 randomly selected customers, what is the probability that at least 8 are satisfied? (hint: One of the keyword in this question is “at least 8”, it is not “exactly 8”, the correct formula for this should be = 1- (binom.dist(7, 10, 0.7, TRUE)). The part in the princess will give you the probability of seven and less than…arrow_forwardplease answer these questionsarrow_forward
- Selon une économiste d’une société financière, les dépenses moyennes pour « meubles et appareils de maison » ont été moins importantes pour les ménages de la région de Montréal, que celles de la région de Québec. Un échantillon aléatoire de 14 ménages pour la région de Montréal et de 16 ménages pour la région Québec est tiré et donne les données suivantes, en ce qui a trait aux dépenses pour ce secteur d’activité économique. On suppose que les données de chaque population sont distribuées selon une loi normale. Nous sommes intéressé à connaitre si les variances des populations sont égales.a) Faites le test d’hypothèse sur deux variances approprié au seuil de signification de 1 %. Inclure les informations suivantes : i. Hypothèse / Identification des populationsii. Valeur(s) critique(s) de Fiii. Règle de décisioniv. Valeur du rapport Fv. Décision et conclusion b) A partir des résultats obtenus en a), est-ce que l’hypothèse d’égalité des variances pour cette…arrow_forwardAccording to an economist from a financial company, the average expenditures on "furniture and household appliances" have been lower for households in the Montreal area than those in the Quebec region. A random sample of 14 households from the Montreal region and 16 households from the Quebec region was taken, providing the following data regarding expenditures in this economic sector. It is assumed that the data from each population are distributed normally. We are interested in knowing if the variances of the populations are equal. a) Perform the appropriate hypothesis test on two variances at a significance level of 1%. Include the following information: i. Hypothesis / Identification of populations ii. Critical F-value(s) iii. Decision rule iv. F-ratio value v. Decision and conclusion b) Based on the results obtained in a), is the hypothesis of equal variances for this socio-economic characteristic measured in these two populations upheld? c) Based on the results obtained in a),…arrow_forwardA major company in the Montreal area, offering a range of engineering services from project preparation to construction execution, and industrial project management, wants to ensure that the individuals who are responsible for project cost estimation and bid preparation demonstrate a certain uniformity in their estimates. The head of civil engineering and municipal services decided to structure an experimental plan to detect if there could be significant differences in project evaluation. Seven projects were selected, each of which had to be evaluated by each of the two estimators, with the order of the projects submitted being random. The obtained estimates are presented in the table below. a) Complete the table above by calculating: i. The differences (A-B) ii. The sum of the differences iii. The mean of the differences iv. The standard deviation of the differences b) What is the value of the t-statistic? c) What is the critical t-value for this test at a significance level of 1%?…arrow_forward
arrow_back_ios
SEE MORE QUESTIONS
arrow_forward_ios
Recommended textbooks for you
 MATLAB: An Introduction with ApplicationsStatisticsISBN:9781119256830Author:Amos GilatPublisher:John Wiley & Sons Inc
 Probability and Statistics for Engineering and th...StatisticsISBN:9781305251809Author:Jay L. DevorePublisher:Cengage Learning
 Statistics for The Behavioral Sciences (MindTap C...StatisticsISBN:9781305504912Author:Frederick J Gravetter, Larry B. WallnauPublisher:Cengage Learning
 Elementary Statistics: Picturing the World (7th E...StatisticsISBN:9780134683416Author:Ron Larson, Betsy FarberPublisher:PEARSON
 The Basic Practice of StatisticsStatisticsISBN:9781319042578Author:David S. Moore, William I. Notz, Michael A. FlignerPublisher:W. H. Freeman
 Introduction to the Practice of StatisticsStatisticsISBN:9781319013387Author:David S. Moore, George P. McCabe, Bruce A. CraigPublisher:W. H. Freeman
MATLAB: An Introduction with Applications
Statistics
ISBN:9781119256830
Author:Amos Gilat
Publisher:John Wiley & Sons Inc
Probability and Statistics for Engineering and th...
Statistics
ISBN:9781305251809
Author:Jay L. Devore
Publisher:Cengage Learning
Statistics for The Behavioral Sciences (MindTap C...
Statistics
ISBN:9781305504912
Author:Frederick J Gravetter, Larry B. Wallnau
Publisher:Cengage Learning
Elementary Statistics: Picturing the World (7th E...
Statistics
ISBN:9780134683416
Author:Ron Larson, Betsy Farber
Publisher:PEARSON
The Basic Practice of Statistics
Statistics
ISBN:9781319042578
Author:David S. Moore, William I. Notz, Michael A. Fligner
Publisher:W. H. Freeman
Introduction to the Practice of Statistics
Statistics
ISBN:9781319013387
Author:David S. Moore, George P. McCabe, Bruce A. Craig
Publisher:W. H. Freeman
Use of ALGEBRA in REAL LIFE; Author: Fast and Easy Maths !;https://www.youtube.com/watch?v=9_PbWFpvkDc;License: Standard YouTube License, CC-BY
Compound Interest Formula Explained, Investment, Monthly & Continuously, Word Problems, Algebra; Author: The Organic Chemistry Tutor;https://www.youtube.com/watch?v=P182Abv3fOk;License: Standard YouTube License, CC-BY
Applications of Algebra (Digit, Age, Work, Clock, Mixture and Rate Problems); Author: EngineerProf PH;https://www.youtube.com/watch?v=Y8aJ_wYCS2g;License: Standard YouTube License, CC-BY