
Concept explainers
Videos
To construct: The graph for the
Explanation of Solution
Given:
Probability of success ( p ) = 0.80
Number of trials ( n ) = 12
Calculation:
Consider, X be the random variable that represents the number of times spinner lands in the blue region follows the binomial distribution with parameters n = 12 and p = 0.80.
The probability distribution can be written as:
Graph:
The figure for the probability distribution of X can be constructed as:
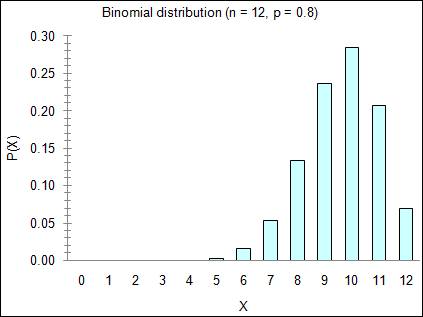
From the above figure, it can be observed that the left tail of the graph is much longer than the right tail, thus the distribution is skewed to the left.
Chapter 6 Solutions
PRACTICE OF STATISTICS F/AP EXAM
Additional Math Textbook Solutions
Elementary Statistics
University Calculus: Early Transcendentals (4th Edition)
Pre-Algebra Student Edition
Calculus: Early Transcendentals (2nd Edition)
Elementary Statistics: Picturing the World (7th Edition)

