
Concept explainers
Videos
(a)
Differences, if any, while comparing the probability distributions of H and F using histogram.
(a)
Answer to Problem 19E
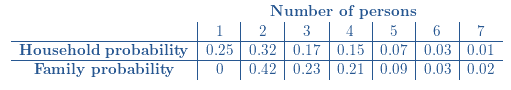
Both distributions are skewed to right with two persons and household having greater spread.
Neither distribution shows outliers.
Explanation of Solution
Given information:
H : the number of people in randomly selected U.S. household
F : the number of people in randomly selected U.S. family
Distributions of household size and family size in U.S:

Histograms for F and H :
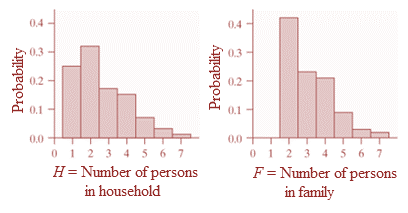
Shape: In the histograms, the highest bars are to the left, whereas a tail of smaller bars is to the right. Thus, both distributions are skewed to the right.
Center: Since the highest bar in both histograms is centered at 2, the most typical number of person in a family as well as in a household is 2.
Spread: Since the histogram of families is narrower than the histogram of households, the spread of number of persons in a household is greater than the spread of number of persons in a family.
Unusual features: Since there are no gaps in the histogram, neither distribution shows outliers.
(b)
(b)
Answer to Problem 19E
Expected values (mean),
For H :
For F :
Explanation of Solution
Given information:
H : the number of people in randomly selected U.S. household
F : the number of people in randomly selected U.S. family
Distributions of household size and family size in U.S:
Histograms for F and H :

The expected mean is the sum of the product of each possibility x with its probability
For Household:
For Family:
Now,
Note that
The mean number of people in a family is greater than the mean number of people in a household.
Since the household can be smaller than families.
Thus,
It makes sense that all families have at least 2 people and all households have at least 1 person.
(c)
Relevance for the difference in standard deviation of two random variables.
(c)
Answer to Problem 19E
There can be one individual in a household, but in a family there should be more than one individual.
Explanation of Solution
Given information:
H : the number of people in randomly selected U.S. household
F : the number of people in randomly selected U.S. family
Distributions of household size and family size in U.S:

Histograms for F and H :

Standard deviation of two random variables,
For H :
For F :
From Part (a),
We conclude that
The spread of the household distribution was greater than the spread of the family distribution due to wider histogram of the household distribution.
According to the statement,
The standard deviation of household is greater than the standard deviation of family.
Thus,
The standard deviation confirms the conclusion.
Moreover,
A household can contain one individual but a family should always contain more than one individual.
Thus,
There are more possible values for the number of individuals in a household which makes its standard deviation greater.
Chapter 6 Solutions
PRACTICE OF STATISTICS F/AP EXAM
Additional Math Textbook Solutions
Elementary Statistics (13th Edition)
College Algebra with Modeling & Visualization (5th Edition)
Algebra and Trigonometry (6th Edition)
Elementary Statistics: Picturing the World (7th Edition)
Pre-Algebra Student Edition
Elementary Statistics


- A marketing agency wants to determine whether different advertising platforms generate significantly different levels of customer engagement. The agency measures the average number of daily clicks on ads for three platforms: Social Media, Search Engines, and Email Campaigns. The agency collects data on daily clicks for each platform over a 10-day period and wants to test whether there is a statistically significant difference in the mean number of daily clicks among these platforms. Conduct ANOVA test. You can provide your answer by inserting a text box and the answer must include: also please provide a step by on getting the answers in excel Null hypothesis, Alternative hypothesis, Show answer (output table/summary table), and Conclusion based on the P value.arrow_forwardA company found that the daily sales revenue of its flagship product follows a normal distribution with a mean of $4500 and a standard deviation of $450. The company defines a "high-sales day" that is, any day with sales exceeding $4800. please provide a step by step on how to get the answers Q: What percentage of days can the company expect to have "high-sales days" or sales greater than $4800? Q: What is the sales revenue threshold for the bottom 10% of days? (please note that 10% refers to the probability/area under bell curve towards the lower tail of bell curve) Provide answers in the yellow cellsarrow_forwardBusiness Discussarrow_forward
 MATLAB: An Introduction with ApplicationsStatisticsISBN:9781119256830Author:Amos GilatPublisher:John Wiley & Sons Inc
 Probability and Statistics for Engineering and th...StatisticsISBN:9781305251809Author:Jay L. DevorePublisher:Cengage Learning
 Statistics for The Behavioral Sciences (MindTap C...StatisticsISBN:9781305504912Author:Frederick J Gravetter, Larry B. WallnauPublisher:Cengage Learning
 Elementary Statistics: Picturing the World (7th E...StatisticsISBN:9780134683416Author:Ron Larson, Betsy FarberPublisher:PEARSON
 The Basic Practice of StatisticsStatisticsISBN:9781319042578Author:David S. Moore, William I. Notz, Michael A. FlignerPublisher:W. H. Freeman
 Introduction to the Practice of StatisticsStatisticsISBN:9781319013387Author:David S. Moore, George P. McCabe, Bruce A. CraigPublisher:W. H. Freeman