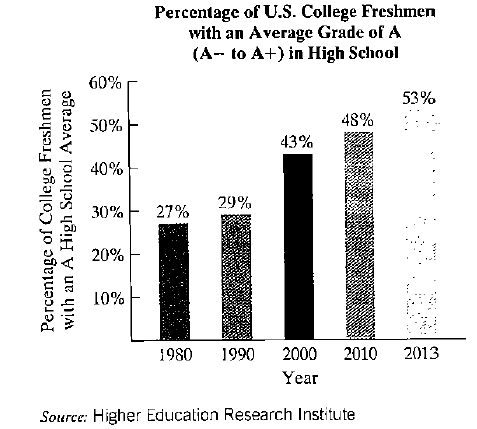
Grade Inflation. The bar graph shows the percentage of U Scollege freshmen with an average grade of A in high school. The data displayed by the bar graph can be described by themathematical model P = 4 x 5 + 25 , where x is the number of years after 1980 and p is the percentage of US college freshmen who had an average grade of A in highschool. Use this information to solve Exercises 107-108. 108. a. According to the formula, in 2000, what percentage of U.S college freshmen had an average grade of A inhigh school? Docs this underestimate or overestimate the percent displayed by the bar graph’’ By howmuch? 41 % $$$ by 2% b. If trends shown by the formula continue, project when65% of U.S. college freshmen will have had an averagegrade of A in high school. 2030
Grade Inflation. The bar graph shows the percentage of U Scollege freshmen with an average grade of A in high school. The data displayed by the bar graph can be described by themathematical model P = 4 x 5 + 25 , where x is the number of years after 1980 and p is the percentage of US college freshmen who had an average grade of A in highschool. Use this information to solve Exercises 107-108. 108. a. According to the formula, in 2000, what percentage of U.S college freshmen had an average grade of A inhigh school? Docs this underestimate or overestimate the percent displayed by the bar graph’’ By howmuch? 41 % $$$ by 2% b. If trends shown by the formula continue, project when65% of U.S. college freshmen will have had an averagegrade of A in high school. 2030
Solution Summary: The author calculates the percentage of U.S. college freshmen having an average grade of A in high school in 2000.
Grade Inflation. The bar graph shows the percentage of U Scollege freshmen with an average grade of A in high school.
The data displayed by the bar graph can be described by themathematical model
P
=
4
x
5
+
25
,
where x is the number of years after 1980 and p is the percentage of US college freshmen who had an average grade of A in highschool. Use this information to solve Exercises 107-108.
108. a. According to the formula, in 2000, what percentage of U.S college freshmen had an average grade of A inhigh school? Docs this underestimate or overestimate the percent displayed by the bar graph’’ By howmuch?
41 % $$$ by 2%
b. If trends shown by the formula continue, project when65% of U.S. college freshmen will have had an averagegrade of A in high school. 2030
2. [-/4 Points]
DETAILS
MY NOTES
SESSCALCET2 7.3.002.
Let S be the solid obtained by rotating the region shown in the figure about the y-axis. (Assume a = 6 and b = 2.)
ASK YOUR TEACHER
0
y = a sin(bx²)
Sketch a typical approximating shell.
y
6
4
2
x
π/b
y
2
1
x
0.5
1.0
1.5
0.2
0.4
0.6
0.8
1.0
-2
-1
-4
Determine the volume and the surface area of the shape obtained by rotating the area of the figure about the x-axis and the y-axis.
Need a deep-dive on the concept behind this application? Look no further. Learn more about this topic, subject and related others by exploring similar questions and additional content below.


 Algebra: Structure And Method, Book 1AlgebraISBN:9780395977224Author:Richard G. Brown, Mary P. Dolciani, Robert H. Sorgenfrey, William L. ColePublisher:McDougal Littell
 Algebra & Trigonometry with Analytic GeometryAlgebraISBN:9781133382119Author:SwokowskiPublisher:Cengage
 Mathematics For Machine TechnologyAdvanced MathISBN:9781337798310Author:Peterson, John.Publisher:Cengage Learning,
 Big Ideas Math A Bridge To Success Algebra 1: Stu...AlgebraISBN:9781680331141Author:HOUGHTON MIFFLIN HARCOURTPublisher:Houghton Mifflin Harcourt
 Holt Mcdougal Larson Pre-algebra: Student Edition...AlgebraISBN:9780547587776Author:HOLT MCDOUGALPublisher:HOLT MCDOUGAL