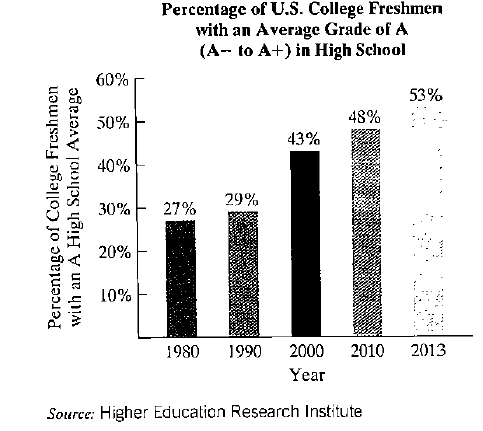
Grade Inflation . The bar graph shows the percentage of UScollege freshmen with an average grade of A in high school. The data displayed by the bar graph can be described by the mathematical model P = 4 x 5 + 25 where x is the number of years after 1980 and p is the percentage of U.S. college freshmen who had an average grade of A in highschool. Use this information to solve Exercises 107-108. 107. a. According to the formula, in 2010, what percentage of U.S. college freshmen had an average grade of A in high school? Does this underestimate or overestimate the percent displayed by the bar graph? By how much? 49. % overestimates by 1% b. If trends shown by the formula continue, project when57% of US. college freshmen will have and an averagegrade of A in high school 2020
Grade Inflation . The bar graph shows the percentage of UScollege freshmen with an average grade of A in high school. The data displayed by the bar graph can be described by the mathematical model P = 4 x 5 + 25 where x is the number of years after 1980 and p is the percentage of U.S. college freshmen who had an average grade of A in highschool. Use this information to solve Exercises 107-108. 107. a. According to the formula, in 2010, what percentage of U.S. college freshmen had an average grade of A in high school? Does this underestimate or overestimate the percent displayed by the bar graph? By how much? 49. % overestimates by 1% b. If trends shown by the formula continue, project when57% of US. college freshmen will have and an averagegrade of A in high school 2020
Solution Summary: The author calculates the percentage of U.S. college freshmen who had an average grade of A in high school in year 2010.
Grade Inflation. The bar graph shows the percentage of UScollege freshmen with an average grade of A in high school.
The data displayed by the bar graph can be described by the mathematical model
P
=
4
x
5
+
25
where x is the number of years after 1980 and p is the percentage of U.S. college freshmen who had an average grade of A in highschool. Use this information to solve Exercises 107-108.
107. a. According to the formula, in 2010, what percentage of U.S. college freshmen had an average grade of A in high school? Does this underestimate or overestimate the percent displayed by the bar graph? By how much? 49. % overestimates by 1%
b. If trends shown by the formula continue, project when57% of US. college freshmen will have and an averagegrade of A in high school 2020
Rashawn read 25 pages of his book each day until he finished the book. His book was 400 pages long.
Which sketch represents this situation?
(0, 400)
(0. 16)
(400, 0)
(16, 0)
Days
Days
10. 400)
0.25
(400. 0)
(25, 0)
Pages remaining
Pages remaining
Pages remaining
Find x.
5 Patrick recorded the daily changes of the
value of a stock in dollars: -3.40, -8.09,
-2.47, 1.86, and 3.55. What was the
average daily change in the stock's value
in dollars?
Show your work.
Solution:.
A Survey of Mathematics with Applications (10th Edition) - Standalone book
Knowledge Booster
Learn more about
Need a deep-dive on the concept behind this application? Look no further. Learn more about this topic, subject and related others by exploring similar questions and additional content below.


 Algebra & Trigonometry with Analytic GeometryAlgebraISBN:9781133382119Author:SwokowskiPublisher:Cengage
 College Algebra (MindTap Course List)AlgebraISBN:9781305652231Author:R. David Gustafson, Jeff HughesPublisher:Cengage Learning
 Algebra: Structure And Method, Book 1AlgebraISBN:9780395977224Author:Richard G. Brown, Mary P. Dolciani, Robert H. Sorgenfrey, William L. ColePublisher:McDougal Littell
 Big Ideas Math A Bridge To Success Algebra 1: Stu...AlgebraISBN:9781680331141Author:HOUGHTON MIFFLIN HARCOURTPublisher:Houghton Mifflin Harcourt
 Holt Mcdougal Larson Pre-algebra: Student Edition...AlgebraISBN:9780547587776Author:HOLT MCDOUGALPublisher:HOLT MCDOUGAL