
Concept explainers
Videos
21. The line graph showy ‘he cost of inflation. What cost$10,000 in 1984 would cost the amount shown by thegraph in subsequent years.
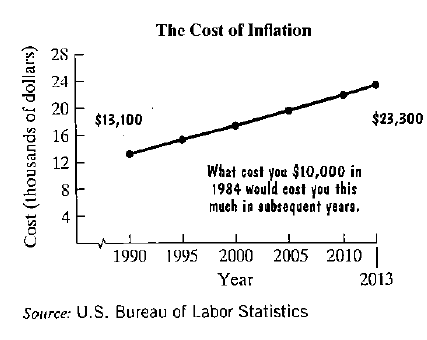
Here are two mathematical models for tie data shown by the graph. In each formula. C represents the cost x yearsafter 1990 or what cost $10,000 in 1984.
Model 1
Model 2
a. Use the graph to estimate the cost in 2010, to the nearestthousand dollars, of what cost $10,000 in 1984 $22,000
b. Use model 1 to determine the cost in 2010 How welldoes this describe your estimate from part (a)? $21,809: reasonably well
c. Use model 2 to determine the cost in 2010. How welldoes this describe your estimate from pan (a)? $21,726: reasonably well
d. Use model 1 to determine in which year the cost will be$26,229 for what cost$10,000 in 1984 2020
Want to see the full answer?
Check out a sample textbook solution
Chapter 6 Solutions
Thinking Mathematically (7th Edition)


- Three players (one divider and two choosers) are going to divide a cake fairly using the lone divider method. The divider cuts the cake into three slices (s1, s2, and s3).If the chooser's declarations are Chooser 1: {s3} and Chooser 2: {s3}, which of the following is a fair division of the cake?arrow_forwardLemma:- Let x = AX, Y° = By where A = B= 0 Bo then the linear system X = AX Y = BY are Linearly equivalent iff B=α.arrow_forwardTheorem 1.4 (Chebyshev's inequality) (i) Suppose that Var X x)≤- x > 0. 2 (ii) If X1, X2,..., X, are independent with mean 0 and finite variances, then Στη Var Xe P(|Sn| > x)≤ x > 0. (iii) If, in addition, X1, X2, Xn are identically distributed, then nVar Xi P(|Sn> x) ≤ x > 0. x²arrow_forward
- Theorem 2.5 (The Lyapounov inequality) For 0arrow_forwardTheorem 1.6 (The Kolmogorov inequality) Let X1, X2, Xn be independent random variables with mean 0 and suppose that Var Xk 0, P(max Sk>x) ≤ Isk≤n Σ-Var X In particular, if X1, X2,..., X, are identically distributed, then P(max Sx) ≤ Isk≤n nVar X₁ x2arrow_forwardTheorem 3.1 (The Cauchy-Schwarz inequality) Suppose that X and Y have finite variances. Then |EXYarrow_forwardAbout 25% of people in America use a certain social media website. In a group with 20 people (assume that it is a random sample of people in America), what are the following probabilities? (Round your answers to three decimal places.) a) At least one of them uses the website. b) More than two of them use the website. c) None of them use the website. d) At least 18 of them do not use the website. please show all steps and work for probabilities. answer parts a-d.arrow_forwardNot use ai pleasearrow_forwardNo chatgpt pls will upvotearrow_forwardCan you prove by induction on n for the followingarrow_forwardExample 4 (Part 2) We can use Statkey to take 50 different random samples of size 20 each, find the mean of each sample, and compute a confidence interval for each one. The graph of the sampling distribution of the means is on the left below, and that of the 50 confidence intervals is on the right. 1. What does each dot on the left hand dotplot represent? StatKey Sampling Distribution for a Mean Percent with Internet Access (Countries) ▾ Show Data Table Edit Data Choose samples of size n = 20 Upload File Change Column(s) Generate 1 Sample Generate 10 Samples Generate 100 Samples Generate 1000 Samples Reset Plot Sampling Dotplot of Mean Left Tail Two-Tail Right Tail 60 50 40 40 30 20 20 10 samples = 50 mean = 41.626 std. error = 5.089 : .: : :: 0 25 30 35 40 45 50 55 60 41.626 Data Plots Confidence Intervals 95%-> Confidence Intervals Coverage 48/50 = 96% 20 40 60 80 2. Circle the confidence intervals that failed to capture the true mean. 3. Circle the sample means that produced those…arrow_forwardCan you prove by induction on n for the followingarrow_forwardarrow_back_iosSEE MORE QUESTIONSarrow_forward_iosRecommended textbooks for you
 Glencoe Algebra 1, Student Edition, 9780079039897...AlgebraISBN:9780079039897Author:CarterPublisher:McGraw Hill
 Elementary AlgebraAlgebraISBN:9780998625713Author:Lynn Marecek, MaryAnne Anthony-SmithPublisher:OpenStax - Rice University
 Trigonometry (MindTap Course List)TrigonometryISBN:9781337278461Author:Ron LarsonPublisher:Cengage Learning
Glencoe Algebra 1, Student Edition, 9780079039897...AlgebraISBN:9780079039897Author:CarterPublisher:McGraw HillElementary AlgebraAlgebraISBN:9780998625713Author:Lynn Marecek, MaryAnne Anthony-SmithPublisher:OpenStax - Rice UniversityTrigonometry (MindTap Course List)TrigonometryISBN:9781337278461Author:Ron LarsonPublisher:Cengage Learning