Concept explainers
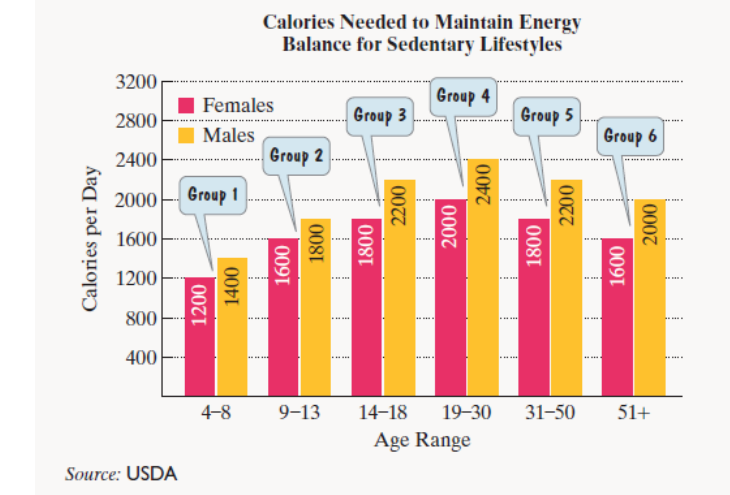
The bar graph shows the estimated number of calories per day needed to maintain energy balance for various gender and age groups for sedentary lifestyles. (Sedentary means a lifestyle that includes only the light physical activity associated with typical day-to-day life.)  Use the appropriate information displayed by the graph to solve Exercises 69-70.
The mathematical model
Want to see the full answer?
Check out a sample textbook solution
Chapter 6 Solutions
Thinking Mathematically (7th Edition)
Additional Math Textbook Solutions
Calculus: Early Transcendentals (2nd Edition)
Precalculus: A Unit Circle Approach (3rd Edition)
Finite Mathematics for Business, Economics, Life Sciences and Social Sciences
Introductory Statistics
Elementary Algebra For College Students (10th Edition)
- please help me solvearrow_forwardTo: [Boss's Name] From: Nathaniel D Sain Date: 4/5/2025 Subject: Decision Analysis for Business Scenario Introduction to the Business Scenario Our delivery services business has been experiencing steady growth, leading to an increased demand for faster and more efficient deliveries. To meet this demand, we must decide on the best strategy to expand our fleet. The three possible alternatives under consideration are purchasing new delivery vehicles, leasing vehicles, or partnering with third-party drivers. The decision must account for various external factors, including fuel price fluctuations, demand stability, and competition growth, which we categorize as the states of nature. Each alternative presents unique advantages and challenges, and our goal is to select the most viable option using a structured decision-making approach. Alternatives and States of Nature The three alternatives for fleet expansion were chosen based on their cost implications, operational efficiency, and…arrow_forwardGolden Ratio search Method f(x) = 2x^3 - 3x^2 - 12x + 1 Golden ratio search rules 1.If f(x) < f(x2): 1. Eliminate all x values less than x2 2. X2 becomes the new a 3. x, becomes the new x2 4. no change in b If f(x) > f(x2): 1. Eliminate all x values greater than x 2. x, becomes the new b 3. x2 becomes the new x 4. no change in aquesion=Narrow the interval in which the minimizer of the function f is located using the golden search method, starting with the initial interval (0,6], until its width is less than 2. Then, accept the midpoint of this interval as an approximate value of the minimizer of the function fand determine it. (ф=0.62)According to the question above, fill in the table below using the algorithm until the appropriate place.please write every step by step in a verry comprehensive wayarrow_forward
- Answer number 1arrow_forwardUse a calculator to find a decimal approximation for the following trigonometric function. cot 226°54' cot 226°54' (Simplify your answer. Type an integer or a decimal. Round to eight decimal places as needed.)arrow_forwardIn preparing for the upcoming holiday season, Fresh Toy Company (FTC) designed a new doll called The Dougie that teaches children how to dance. The fixed cost to produce the doll is $100,000. The variable cost, which includes material, labor, and shipping costs, is $31 per doll. During the holiday selling season, FTC will sell the dolls for $39 each. If FTC overproduces the dolls, the excess dolls will be sold in January through a distributor who has agreed to pay FTC $10 per doll. Demand for new toys during the holiday selling season is extremely uncertain. Forecasts are for expected sales of 60,000 dolls with a standard deviation of 15,000. The normal probability distribution is assumed to be a good description of the demand. FTC has tentatively decided to produce 60,000 units (the same as average demand), but it wants to conduct an analysis regarding this production quantity before finalizing the decision. (a) Determine the equation for computing FTC's profit for given values of the…arrow_forward
 Mathematics For Machine TechnologyAdvanced MathISBN:9781337798310Author:Peterson, John.Publisher:Cengage Learning,
 Glencoe Algebra 1, Student Edition, 9780079039897...AlgebraISBN:9780079039897Author:CarterPublisher:McGraw Hill
 Big Ideas Math A Bridge To Success Algebra 1: Stu...AlgebraISBN:9781680331141Author:HOUGHTON MIFFLIN HARCOURTPublisher:Houghton Mifflin Harcourt
 Algebra and Trigonometry (MindTap Course List)AlgebraISBN:9781305071742Author:James Stewart, Lothar Redlin, Saleem WatsonPublisher:Cengage Learning
 Trigonometry (MindTap Course List)TrigonometryISBN:9781337278461Author:Ron LarsonPublisher:Cengage Learning
 Linear Algebra: A Modern IntroductionAlgebraISBN:9781285463247Author:David PoolePublisher:Cengage Learning


