
Concept explainers
Videos
A shop works a 400-minute day. The manager of the shop wants an output of 200 units per day for the assembly line that has the elemental tasks shown in the table. Do the following:
a. Construct the precedence diagram.
b. Assign tasks according to the most following tasks rule. Break ties with the greatest positional weight rule.
c. Assign tasks according to the greatest positional weight rule. Break ties with the most following tasks rule.
d. Compute the balance delay for each rule. Which one yields the better set of assignments in this instance?
a)
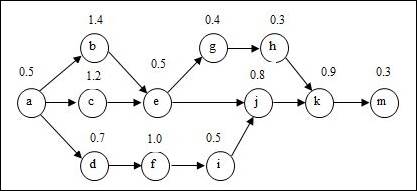
To draw: The precedence diagram.
Introduction:
Process selection:
It is the tactical choices made by a firm in picking the kind of production procedure to be followed in the process of production. The process is selected after reviewing many numbers of criteria and constraints.
Answer to Problem 8P
Precedence diagram:
Explanation of Solution
Given information:
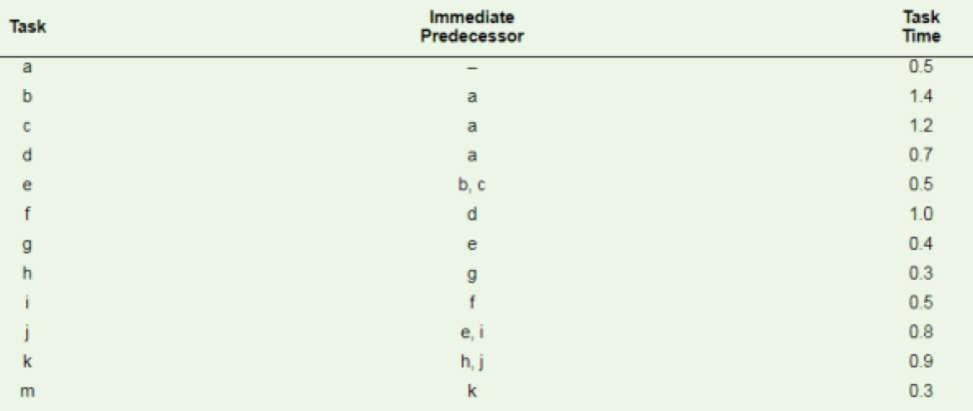
| Task | Task time (Minutes) | Immediate predecessor |
| a | 0.5 | Nil |
| b | 1.4 | a |
| c | 1.2 | a |
| d | 0.7 | a |
| e | 0.5 | b, c |
| f | 1 | d |
| g | 0.4 | e |
| h | 0.3 | g |
| i | 0.5 | f |
| j | 0.8 | e, i |
| k | 0.9 | h, j |
| m | 0.3 | k |
Number of minutes per day = 400
Desired output per day = 200 units
Precedence diagram:
The precedence diagram is drawn circles and arrows. The tasks are represented in circles and weights for each task are represented outside the circle. The arrows are represented to show which task is preceding the other task and so on.
b)
To assign: Tasks on the basis of most following tasks.
Introduction:
Process selection:
It is the tactical choices made by a firm in picking the kind of production procedure to be followed in the process of production. The process is selected after reviewing many numbers of criteria and constraints.
Explanation of Solution
Given information:
| Task | Task time (Minutes) | Immediate predecessor |
| a | 0.5 | Nil |
| b | 1.4 | a |
| c | 1.2 | a |
| d | 0.7 | a |
| e | 0.5 | b, c |
| f | 1 | d |
| g | 0.4 | e |
| h | 0.3 | g |
| i | 0.5 | f |
| j | 0.8 | e, i |
| k | 0.9 | h, j |
| m | 0.3 | k |
Number of minutes per day = 400
Desired output per day = 200 units
Calculation of cycle time:
The cycle time is calculated by dividing the operating time per day by the desired output per day.
The number of following tasks, calculation of positional weight for each task is shown below.
| Task | Following tasks | Number of following tasks | Calculation of positional weight | Positional weight |
| a | b, c, d, e, f, g, h, i, j, k, m | 11 | 0.5 + 1.4 + 1.2 + 0.7 + 0.5 + 1 + 0.4 + 0.3 + 0.5 + 0.8 + 0.9 + 0.3 | 8.5 |
| b | e, g, h, j, k, m | 6 | 1.4 + 0.5 + 0.4 + 0.3 + 0.8 + 0.9 + 0.3 | 4.6 |
| c | e, g, h, j, k, m | 6 | 1.2 + 0.5 + 0.4 + 0.3 + 0.8 + 0.9 + 0.3 | 4.4 |
| d | f, i, j, k, m | 5 | 0.7 + 1 + 0.5 + 0.8 + 0.9 + 0.3 | 4.2 |
| e | g, h, j, k, m | 5 | 0.5 + 0.4 + 0.3 + 0.8+ 0.9 + 0.3 | 3.2 |
| f | i, j, k, m | 4 | 1 + 0.5 + 0.8 + 0.9 + 0.3 | 3.5 |
| g | h, k, m | 3 | 0.4 + 0.3 + 0.9 + 0.3 | 1.9 |
| h | k, m | 2 | 0.3 + 0.9 + 0.3 | 1.5 |
| i | j, k, m | 3 | 0.5 + 0.8 0.9 + 0.3 | 2.5 |
| j | k, m | 2 | 0.8 + 0.9 + 0.3 | 2 |
| k | m | 1 | 0.9 + 0.3 | 1.2 |
| m | Nil | 0 | 0.3 | 0.3 |
Assigning tasks to workstations:
| Workstation number | Eligible task | Assigned task | Task time | Unassigned cycle time | Reason |
| 2 | |||||
| 1 | a | a | 0.5 | 1.5 | Task 'a' is the only eligible task available |
| b, c, d | b | 1.4 | 0.1 | Task 'b' has the highest positional weight | |
| c, d | None | 0.1 (Idle time) | The task time is greater than the unassigned cycle time. | ||
| 2 | |||||
| 2 | c, d | c | 1.2 | 0.8 | Task 'c' has more following tasks |
| d, e | d | 0.7 | 0.1 | Task 'd' has the highest positional weight | |
| e, f | None | 0.1 (Idle time) | The task time is greater than the unassigned cycle time. | ||
| 2 | |||||
| 3 | e, f | e | 0.5 | 1.5 | Task 'e' has more following tasks |
| f, g | f | 1 | 0.5 | Task 'f' has more following tasks | |
| g, i | i | 0.5 | 0 | Task 'i' has the highest positional weight | |
| 2 | |||||
| 4 | g, j | g | 0.4 | 1.6 | Task 'g' has more following tasks |
| h, j | j | 0.8 | 0.8 | Task 'j' has the highest positional weight | |
| h | h | 0.3 | 0.5 | Task 'h' is the only eligible task available | |
| k | None | 0.5 (Idle time) | The task time is greater than the unassigned cycle time. | ||
| 2 | |||||
| 5 | k | k | 0.9 | 1.1 | Task 'k' is the only eligible task available |
| m | m | 0.3 | 0.8 | Task 'm' is the only task remaining | |
| 0.8 (Idle time) | All tasks completed |
Overview of tasks assignment:
| Workstation | Assigned tasks | Total cycle time used | Idle time |
| 1 | a, b | 1.9 | 0.1 |
| 2 | c, d | 1.9 | 0.1 |
| 3 | e, f, i | 2 | 0 |
| 4 | g, j, h | 1.5 | 0.5 |
| 5 | k, m | 1.2 | 0.8 |
c)
To assign: Tasks on the basis of greatest positional weight.
Introduction:
Process selection:
It is the tactical choices made by a firm in picking the kind of production procedure to be followed in the process of production. The process is selected after reviewing many numbers of criteria and constraints.
Explanation of Solution
Given information:
| Task | Task time (Minutes) | Immediate predecessor |
| a | 0.5 | Nil |
| b | 1.4 | a |
| c | 1.2 | a |
| d | 0.7 | a |
| e | 0.5 | b, c |
| f | 1 | d |
| g | 0.4 | e |
| h | 0.3 | g |
| i | 0.5 | f |
| j | 0.8 | e, i |
| k | 0.9 | h, j |
| m | 0.3 | k |
Number of minutes per day = 400
Desired output per day = 200 units
Calculation of cycle time:
The cycle time is calculated by dividing the operating time per day by the desired output per day.
The number of following tasks, calculation of positional weight for each task is shown below.
| Task | Following tasks | Number of following tasks | Calculation of positional weight | Positional weight |
| a | b, c, d, e, f, g, h, i, j, k, m | 11 | 0.5 + 1.4 + 1.2 + 0.7 + 0.5 + 1 + 0.4 + 0.3 + 0.5 + 0.8 + 0.9 + 0.3 | 8.5 |
| b | e, g, h, j, k, m | 6 | 1.4 + 0.5 + 0.4 + 0.3 + 0.8 + 0.9 + 0.3 | 4.6 |
| c | e, g, h, j, k, m | 6 | 1.2 + 0.5 + 0.4 + 0.3 + 0.8 + 0.9 + 0.3 | 4.4 |
| d | f, i, j, k, m | 5 | 0.7 + 1 + 0.5 + 0.8 + 0.9 + 0.3 | 4.2 |
| e | g, h, j, k, m | 5 | 0.5 + 0.4 + 0.3 + 0.8+ 0.9 + 0.3 | 3.2 |
| f | i, j, k, m | 4 | 1 + 0.5 + 0.8 + 0.9 + 0.3 | 3.5 |
| g | h, k, m | 3 | 0.4 + 0.3 + 0.9 + 0.3 | 1.9 |
| h | k, m | 2 | 0.3 + 0.9 + 0.3 | 1.5 |
| i | j, k, m | 3 | 0.5 + 0.8 0.9 + 0.3 | 2.5 |
| j | k, m | 2 | 0.8 + 0.9 + 0.3 | 2 |
| k | m | 1 | 0.9 + 0.3 | 1.2 |
| m | Nil | 0 | 0.3 | 0.3 |
Assigning tasks to workstations:
| Workstation number | Eligible task | Assigned task | Task time | Unassigned cycle time | Reason |
| 2 | |||||
| 1 | a | a | 0.5 | 1.5 | Task 'a' is the only eligible task available |
| b, c, d | b | 1.4 | 0.1 | Task 'b' has the highest positional weight | |
| c, d | None | 0.1 (Idle time) | The task time is greater than the unassigned cycle time. | ||
| 2 | |||||
| 2 | c, d | c | 1.2 | 0.8 | Task 'c' has the highest positional weight |
| d, e | d | 0.7 | 0.1 | Task 'd' has the highest positional weight | |
| e, f | None | 0.1 (Idle time) | The task time is greater than the unassigned cycle time. | ||
| 2 | |||||
| 3 | e, f | f | 1 | 1 | Task 'f' has the highest positional weight |
| e, i | e | 0.5 | 0.5 | Task 'e' has the highest positional weight | |
| g, i | i | 0.5 | 0 | Task 'g' has the highest positional weight | |
| 2 | |||||
| 4 | g, j | j | 0.8 | 1.2 | Task 'j' has the highest positional weight |
| g | g | 0.4 | 0.8 | Task 'g' is the only eligible task available | |
| h | h | 0.3 | 0.5 | Task 'h' is the only eligible task available | |
| k | None | 0.5 (Idle time) | The task time is greater than the unassigned cycle time. | ||
| 2 | |||||
| 5 | k | k | 0.9 | 1.1 | Task 'k' is the only eligible task available |
| m | m | 0.3 | 0.8 | Task 'm' is the only task remaining | |
| 0.8 (Idle time) | All tasks completed |
Overview of tasks assignment:
| Workstation | Assigned tasks | Total cycle time used | Idle time |
| 1 | a, b | 1.9 | 0.1 |
| 2 | c, d | 1.9 | 0.1 |
| 3 | f, e, i | 2 | 0 |
| 4 | j, g, h | 1.5 | 0.5 |
| 5 | k, m | 1.2 | 0.8 |
d)
To determine: The balance delay.
Introduction:
Process selection:
It is the tactical choices made by a firm in picking the kind of production procedure to be followed in the process of production. The process is selected after reviewing many numbers of criteria and constraints.
Answer to Problem 8P
Explanation of Solution
The balance delay is also known as the percentage of idle time.
Formula to calculate percentage of idle time:
Calculation of percentage of idle time:
Most following tasks:
The percentage of idle time is 15%.
Greatest positional weight:
The percentage of idle time is 15%.
The balance delay for most following tasks and greatest positional weight rule is 15%.
Want to see more full solutions like this?
Chapter 6 Solutions
Loose-leaf for Operations Management (The Mcgraw-hill Series in Operations and Decision Sciences)


- what is an other difination for principle?arrow_forwardNeed help or ideas to design out two slides as my script and writing quite long to squeese into two slides. But can just point form in slides with correct title and a good script for me to present two slides in only 2.5 mins. Following is my draft, pls guide me step by step on powerpoint creation and good script to present findings. My draft: Slide 1: Foreign Labor Exploitation in Dyson's Supply Chain Introduction Dyson's former Malaysian supplier, ATA IMS Bhd, became embroiled in serious labor exploitation allegations in 2021. These concerns surfaced when whistleblowers exposed unethical labor practices affecting migrant workers, primarily from Nepal and Bangladesh. Key Forms of Exploitation Debt Bondage Due to Recruitment Fees Workers were forced to pay exorbitant recruitment fees before securing employment, often taking loans at high interest rates. This financial burden trapped them in debt bondage, leaving them with little choice but to accept exploitative working…arrow_forwardNot use ai pleasearrow_forward
- The Business Development Bank of Canada. (2023). Canadian economic outlook for 2024: Shifting into neutral. https://www.bdc.ca/en/articles-tools/blog/canadian-economic-outlook-for-2024-shifting-into-neutral “Despite persistently high inflation and rising interest rates, the news was generally better than expected for the Canadian economy in 2023” (BDC Blog 2024). Discussion Question: In your view, what are the most pressing problems for Canadian companies or consumers in 2024? Explain your answer using current examples of companies or consumer concerns.arrow_forwardhow have idividual objectives led to the current situation at TeraCog? what should Emaa do?arrow_forwardCan you write me an email about addressing an issue to mentor my supervisor the right way of deligating operations dutiesarrow_forward
- Can you right me an email about addressing an issue to mentor the right why of deligating operations dutiesarrow_forwardDefine delegation. Discuss in detail the four reasons why managers do delegation? Also statethe four main types of delegation.arrow_forwardB) Going forward, is Lean/JIT worth the risks? Should it be embraced (why?), abandoned (if so, why & what are the costs), or modified (how?) Do you think Lean works or not? Please write a complete response (about 1-2 paragraphs each part). Each team member should discuss and contribute so that the group agrees on their joint response. Please help each other and build upon and/or challenge others' points (in a respectful way!)arrow_forward
- Discuss the principle reasons that employee benefits have risen over the past 20 years, along with how best an organization can provide employees with a fair wage yet also provide some level of employee benefit coverage.arrow_forwardPlease assist with the Case Study below as attached. Read the case study below and answer the questions that follow. The Importance of the Planning Phase to Project Success. Traditional wisdom is that planning and analysis are very important and the more there is in a project, the more successful the project will be. Time spent on these activities will reduce risk and increase project success. On the other hand, inadequate analysis and planning will lead to a failed project. If poor planning has led to failed projects, then perhaps billions of dollars have been lost. But how much is too much? “Light weight” project management techniques such as agile are gaining popularity. Part of their ethos is that less initial planning is better and an evolutionary process is more efficient. QUESTION 1 The article above states: “Traditional wisdom is that planning and analysis are very important and the more there is in a project, the more successful the project will be”. Describe FIVE (5) ways…arrow_forwardOn a daily basis, the van is dispatched from Maplewood Hospital to pickup blood and platelet donations made at its local donation centers. The distances in miles between all locations may be found in the table below. Click the icon to view mileage data for Vampire Van. a. The van travels from the Hospital (A) to (B) to (C) to (D) to (E) and then returns to the Hospital (A). What is the total number of miles that the van must travel using this route? Route ABCDEA requires a total distance of 20.4 miles. (Enter your response rounded to one decimal place.) b. Using Maplewood Hospital as the beginning location, create a route using the Nearest Neighbor heuristic. What is the total number of miles that the van must travel using this route? The new route is A A and requires a total distance of miles. (Enter your response rounded to one decimal place.) More Info Maplewood City Center Westbrook Hospital (A) Donation Site (B) Donation Site (C) Municipal Park Donation Site (D) Valley Hills…arrow_forward
 Practical Management ScienceOperations ManagementISBN:9781337406659Author:WINSTON, Wayne L.Publisher:Cengage,
 MarketingMarketingISBN:9780357033791Author:Pride, William MPublisher:South Western Educational Publishing
 Purchasing and Supply Chain ManagementOperations ManagementISBN:9781285869681Author:Robert M. Monczka, Robert B. Handfield, Larry C. Giunipero, James L. PattersonPublisher:Cengage Learning