Among the following visualization, the best one should be determined which represents the distribution of SO 2 and O 2 gas molecules near an orifice and after some time effusion takes place in the direction denoted by arrows. Concept introduction: The effusion of gases through orifice can be explained with the help of Graham’s law of effusion. According to the Graham’s law of effusion, rate of effusion of any gas is always inversely proportional to the square root of the mass of gaseous particles. The mathematical expression for this law is: Rate of effusion of gas 1 Rate of effusion of gas 2 = M 2 M 1 Here, M 1 and M 2 represent the molar mass of gases. In terms of time for gases; Effusion time of gas 1 Effusion time of gas 2 = M 1 M 2
Among the following visualization, the best one should be determined which represents the distribution of SO 2 and O 2 gas molecules near an orifice and after some time effusion takes place in the direction denoted by arrows. Concept introduction: The effusion of gases through orifice can be explained with the help of Graham’s law of effusion. According to the Graham’s law of effusion, rate of effusion of any gas is always inversely proportional to the square root of the mass of gaseous particles. The mathematical expression for this law is: Rate of effusion of gas 1 Rate of effusion of gas 2 = M 2 M 1 Here, M 1 and M 2 represent the molar mass of gases. In terms of time for gases; Effusion time of gas 1 Effusion time of gas 2 = M 1 M 2
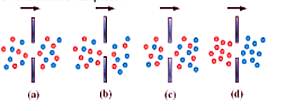
Among the following visualization, the best one should be determined which represents the distribution of SO2 and O2 gas molecules near an orifice and after some time effusion takes place in the direction denoted by arrows.
Concept introduction:
The effusion of gases through orifice can be explained with the help of Graham’s law of effusion. According to the Graham’s law of effusion, rate of effusion of any gas is always inversely proportional to the square root of the mass of gaseous particles.
The mathematical expression for this law is:
Rate of effusion of gas 1Rate of effusion of gas 2=M2M1
Here, M1 and M2 represent the molar mass of gases.
For which element is the 3d subshell higher in energy than that 4s subshell?
Group of answer choices
Zr
Ca
V
Ni
ii) Molecular ion peak
:the peak corresponding to the intact molecule (with a positive charge)
What would the base peak and Molecular ion peaks when isobutane is subjected
to Mass spectrometry? Draw the structures and write the molecular weights of
the fragments.
Circle most stable cation
a) tert-butyl cation
b) Isopropyl cation c) Ethyl cation. d) Methyl cation
6. What does a loss of 15 represent in Mass spectrum?
a fragment of the molecule with a mass of 15 atomic mass units has been lost during
the ionization Process
7. Write the isotopes and their % abundance of isotopes of
i) Cl
Choose a number and match the atomic number to your element on the periodic table. For your element, write each of these features on a side of your figure.
1. Element Name and symbol
2. Family and group
3. What is it used for?
4. Sketch the Valence electron orbital
5. What ions formed. What is it's block on the periodic table.
6. Common compounds
7. Atomic number
8. Mass number
9. Number of neutrons- (show calculations)
10. Sketch the spectral display of the element
11.Properties
12. Electron configuration
13. Submit a video of a 3-meter toss in slow-mo
Chapter 6 Solutions
Selected Solutions Manual For General Chemistry: Principles And Modern Applications
Need a deep-dive on the concept behind this application? Look no further. Learn more about this topic, chemistry and related others by exploring similar questions and additional content below.
Author:Steven D. Gammon, Ebbing, Darrell Ebbing, Steven D., Darrell; Gammon, Darrell Ebbing; Steven D. Gammon, Darrell D.; Gammon, Ebbing; Steven D. Gammon; Darrell
Author:Steven D. Gammon, Ebbing, Darrell Ebbing, Steven D., Darrell; Gammon, Darrell Ebbing; Steven D. Gammon, Darrell D.; Gammon, Ebbing; Steven D. Gammon; Darrell


 General Chemistry - Standalone book (MindTap Cour...ChemistryISBN:9781305580343Author:Steven D. Gammon, Ebbing, Darrell Ebbing, Steven D., Darrell; Gammon, Darrell Ebbing; Steven D. Gammon, Darrell D.; Gammon, Ebbing; Steven D. Gammon; DarrellPublisher:Cengage Learning
 Chemistry for Engineering StudentsChemistryISBN:9781337398909Author:Lawrence S. Brown, Tom HolmePublisher:Cengage Learning
 Chemistry by OpenStax (2015-05-04)ChemistryISBN:9781938168390Author:Klaus Theopold, Richard H Langley, Paul Flowers, William R. Robinson, Mark BlaserPublisher:OpenStax
 Chemistry: Principles and ReactionsChemistryISBN:9781305079373Author:William L. Masterton, Cecile N. HurleyPublisher:Cengage Learning
 Chemistry: An Atoms First ApproachChemistryISBN:9781305079243Author:Steven S. Zumdahl, Susan A. ZumdahlPublisher:Cengage Learning
 Chemistry: The Molecular ScienceChemistryISBN:9781285199047Author:John W. Moore, Conrad L. StanitskiPublisher:Cengage Learning